Canola sowing time to maximise yield in Western Australia

Page last updated: Friday, 20 October 2023 - 2:47pm

Please note: This content may be out of date and is currently under review.

Risk

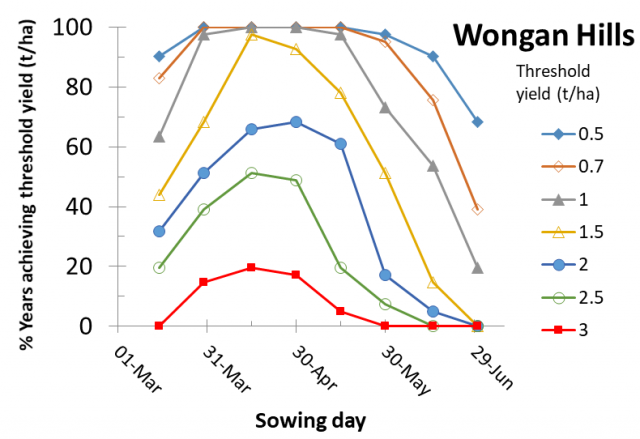
With late sowing, it is important to assess chances of achieving a certain yield. For example, in Wongan Hills, there is a reasonable chance (more than 90%) of getting 1.0t/ha when sowing between the beginning of April and mid May, but this is reduced to around 60% for sowing at the end of May (Figure 2). This is based on last 41 years of climate data.

In any given year, a later sowing may yield well if the rain is optimally distributed throughout the season. The APSIM model results are a guide; so if you have information that your soil is better than average, that the season is looking to be better than average, or that the price is looking better than average you should take these things into account.
Example graph for percentage of years (%) with yield above certain thresholds for the period 1976-2016
Figure 2 Percentage of years (%) with yield above certain thresholds for the period 1976-2016 for Wongan Hills, on a duplex soil, sowing a mid maturity canola cultivar for the different sowing dates studied. Yield thresholds were 0.5, 0.7, 1, 1.5, 2.0, 2.5 and 3.0t/ha.

Locations

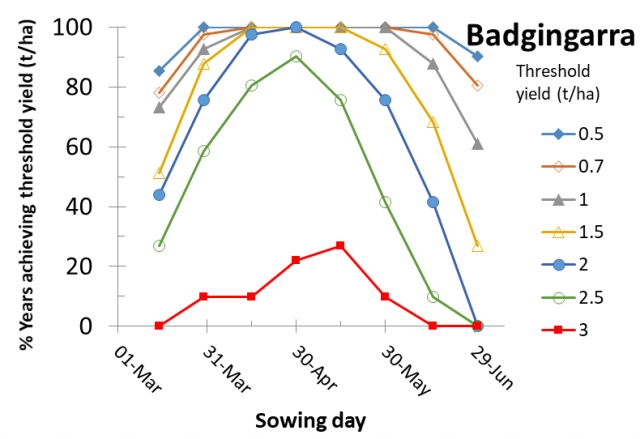
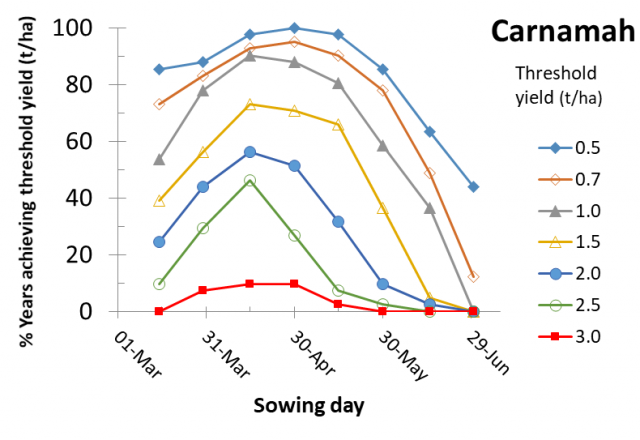
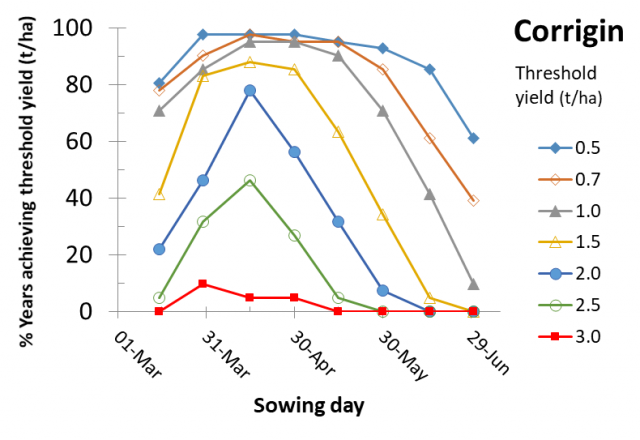
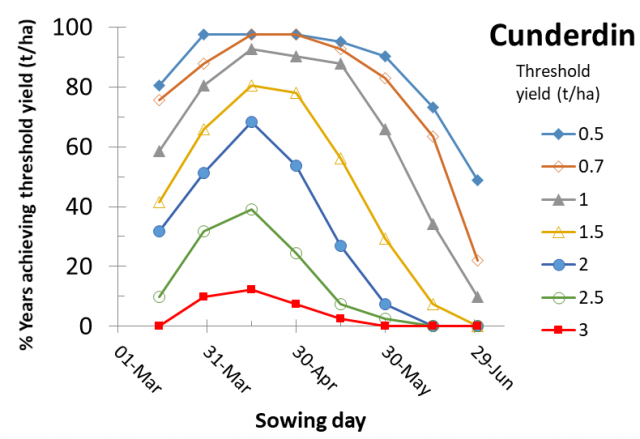
This section contains information for each location studied, based on average of 41 years of APSIM-Canola simulations using local climate data.

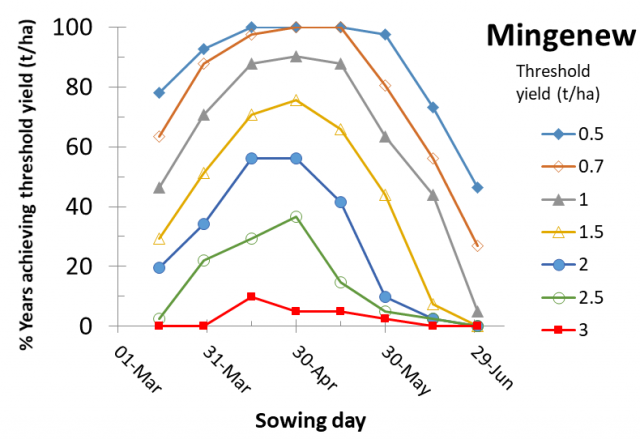
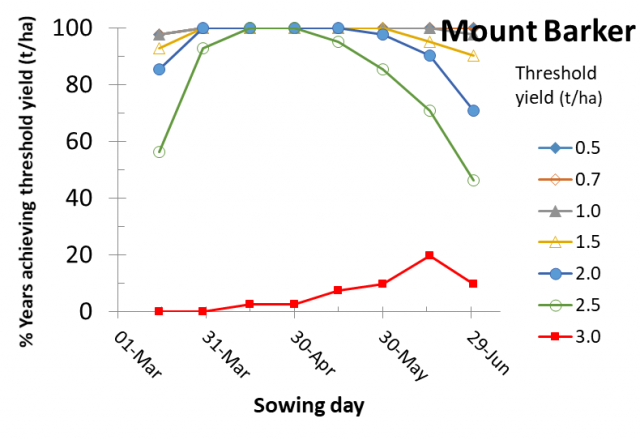
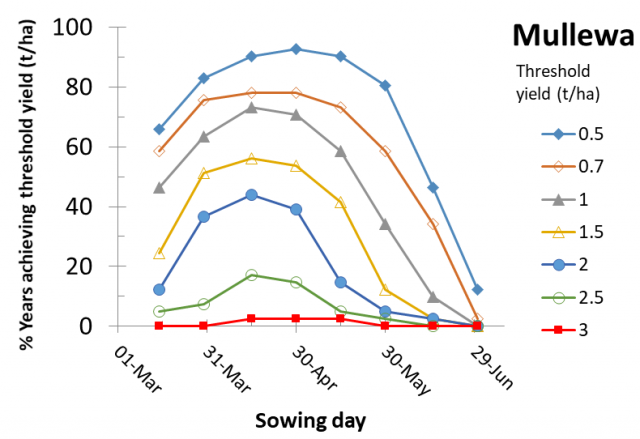
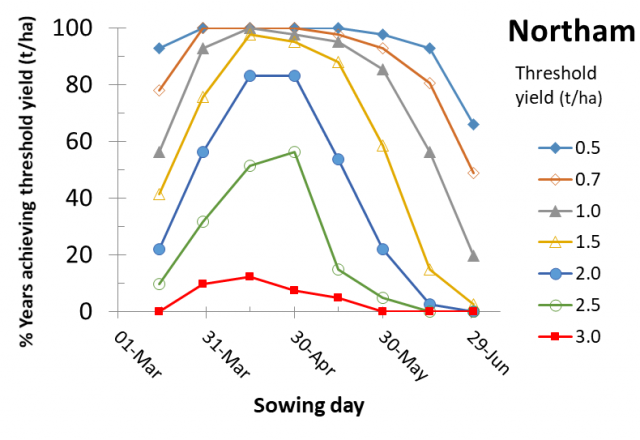
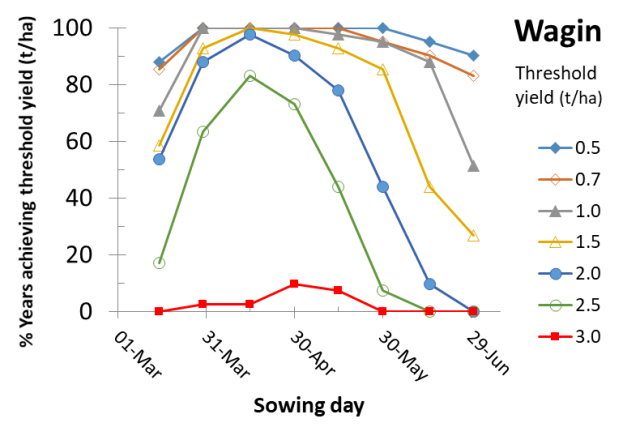
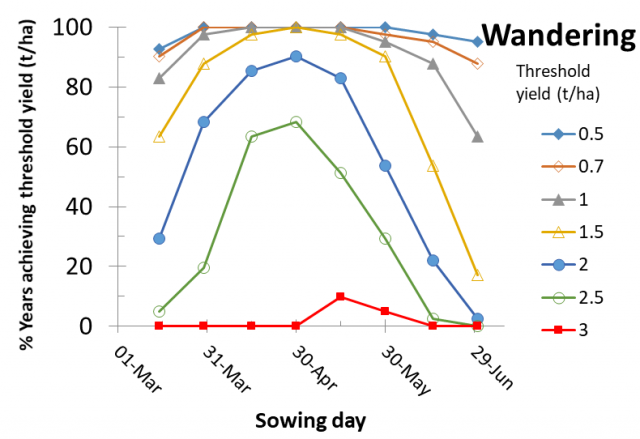
  • Risk graph: A graph of the risk profile or the chances of getting certain yields by certain sowing dates, for a medium maturity cultivar (ATR Bonito) on a duplex soil

Badgingarra

Figure 3 Badgingarra risk profile for canola yields according to time of sowing

Carnamah

Figure 4 Carnamah risk profile for canola yields according to time of sowing

Corrigin

Figure 5 Corrigin risk profile for canola yields according to time of sowing

Cunderdin

Figure 6 Cunderdin risk profile for canola yields according to time of sowing

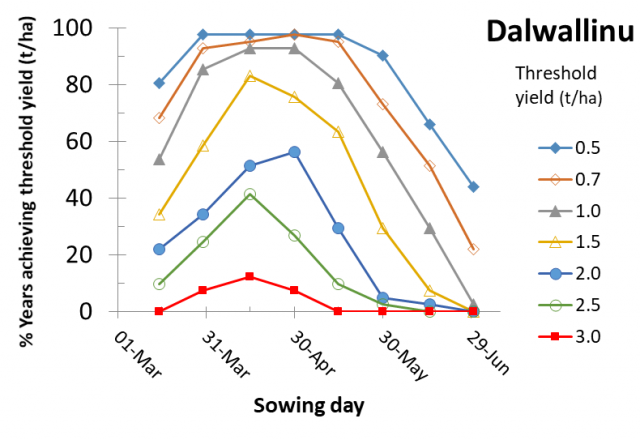
Dalwallinu

Figure 7 Dalwallinu risk profile for canola yields according to time of sowing

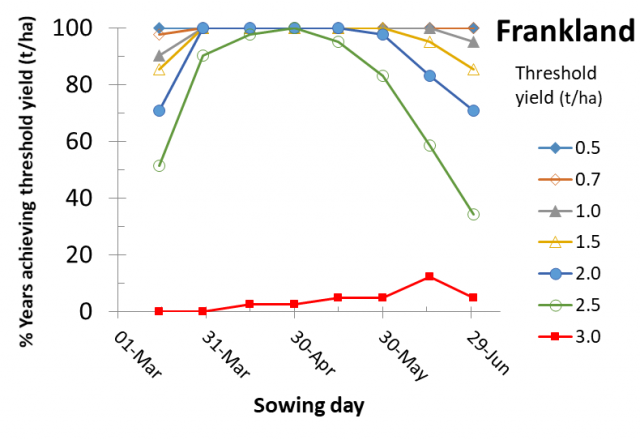
Frankland

Figure 8 Frankland risk profile for canola yields according to time of sowing

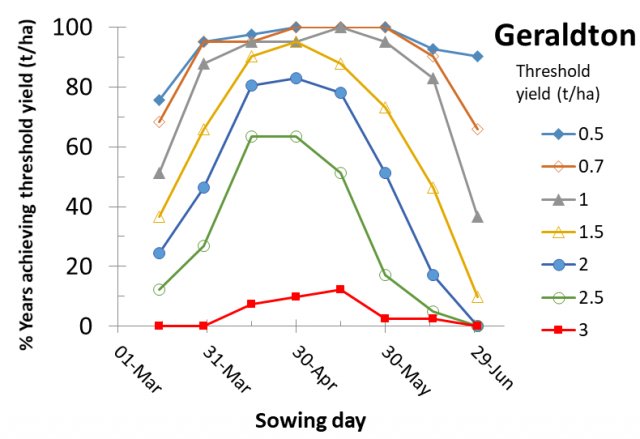
Geraldton

Figure 9 Geraldton risk profile for canola yields according to time of sowing

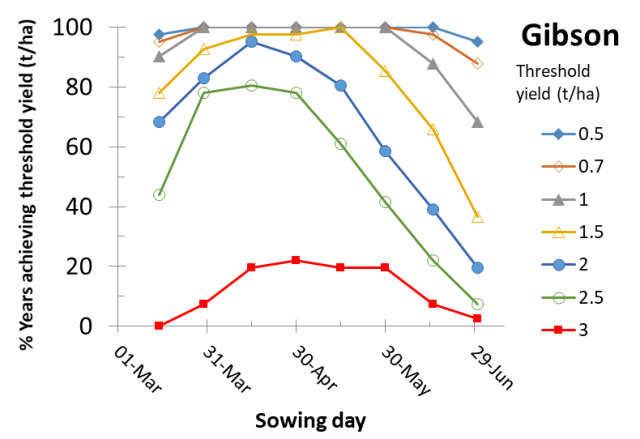
Gibson

Figure 10 Gibson risk profile for canola yields according to time of sowing

Hyden

Figure 11 Hyden risk profile for canola yields according to time of sowing

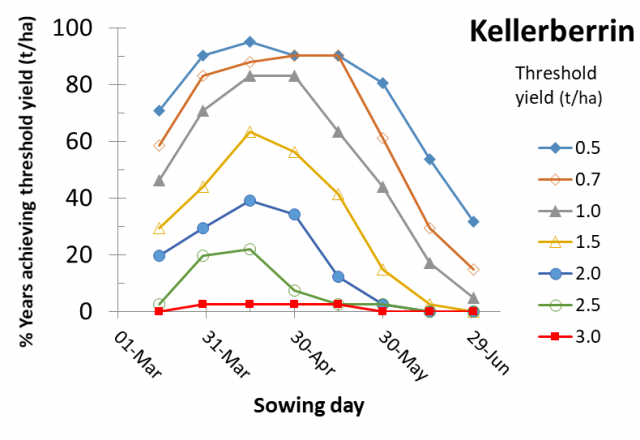
Kellerberin

Figure 12 Kellerberrin risk profile for canola yields according to time of sowing

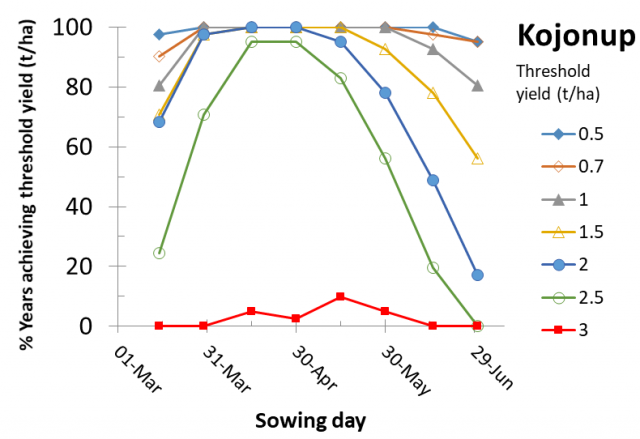
Kojonup

Figure 13 Kojonup risk profile for canola yields according to time of sowing

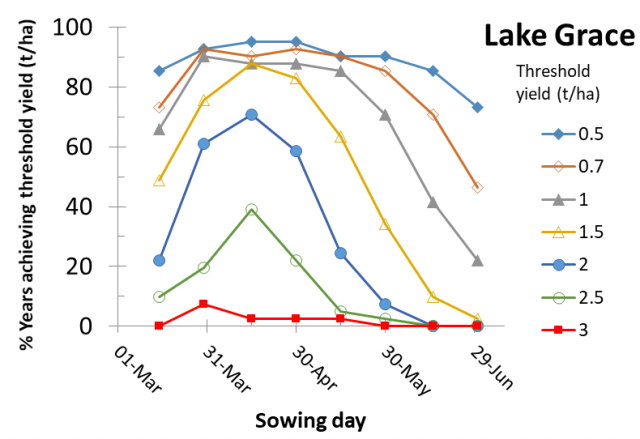
Lake Grace

Figure 14 Lake Grace risk profile for canola yields according to time of sowing

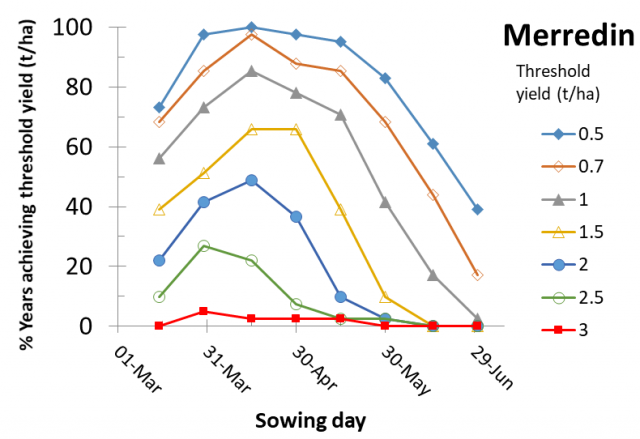
Merredin

Figure 15 Merredin risk profile for canola yields according to time of sowing

Mingenew

Figure 16 Mingenew risk profile for canola yields according to time of sowing

Mount Barker

Figure 17 Mount Barker risk profile for canola yields according to time of sowing

Mullewa

Figure 18 Mullewa risk profile for canola yields according to time of sowing

Northam

Figure 19 Northam risk profile for canola yields according to time of sowing

Ongerup

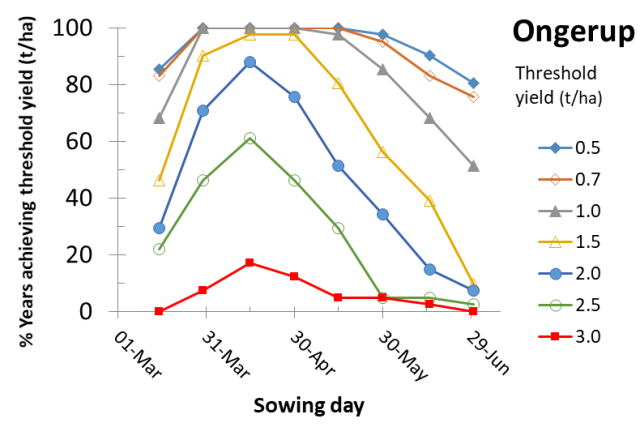
Figure 20 Ongerup risk profile for canola yields according to time of sowing

Ravensthorpe

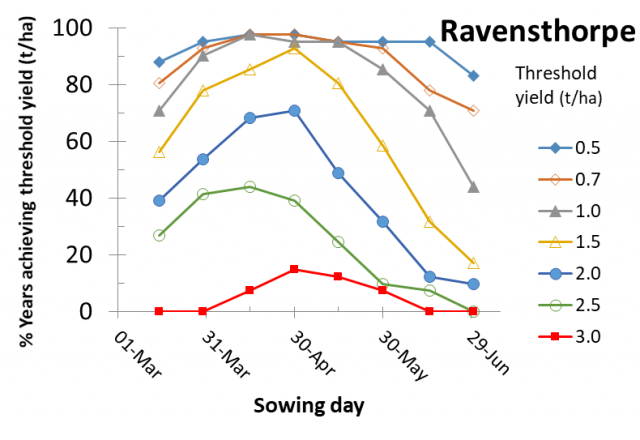
Figure 21 Ravensthorpe risk profile for canola yields according to time of sowing

Salmon Gums

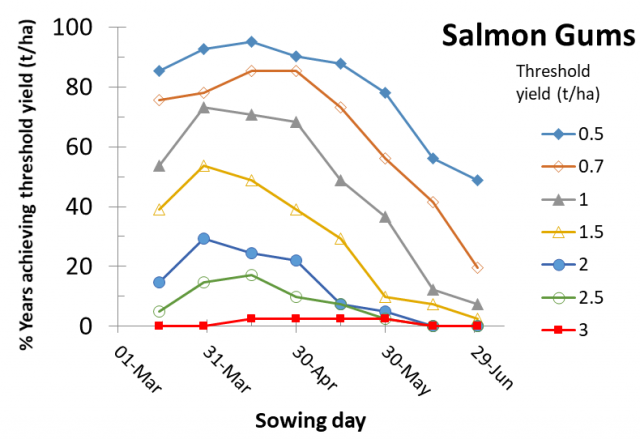
Figure 22 Salmon Gums risk profile for canola yields according to time of sowing

Southern Cross

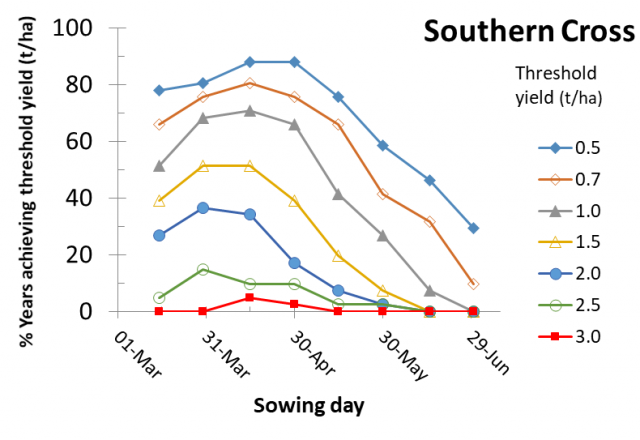
Figure 23 Southern Cross risk profile for canola yields according to time of sowing

Wagin

Figure 24 Wagin risk profile for canola yields according to time of sowing

Wandering

Figure 25 Wandering risk profile for canola yields according to time of sowing

Wongan Hills

Figure 26 Wongan Hills risk profile for canola yields according to time of sowing

References

Farre I, Robertson MJ, Walton GH, Asseng S (2002) Simulating phenology and yield response of canola to sowing date in Western Australia using the APSIM model. Australian Journal of Agricultural Research 53, 1155-1164.

Acknowledgments

This information was produced by Department of Primary Industries and Regional Development's Tactical Break Crop Agronomy Project (DAW00227), co-funded by Grains Research and Development Corporation.