Aims
- To determine the extent of yield loss caused by high levels of aphid infestation on canola in the northern agricultural region.
- To re-investigate management guidelines.
Background
Concerns are increasing that the yield loss of canola to aphids is being underestimated. There are two main mechanisms which cause yield loss;
Feeding damage caused by species such as cabbage aphid (CA) which colonise flowering and podding spikelets. Previous trials have reported canola to be tolerant to aphid damage with little yield loss unless plants are water stressed (Berlandier and Cartwright 1998; Berlandier and Valentine 2001). In 2003 a threshold for aphid control of 20% or more of flowering spikes infested with aphids was reported (Berlandier and Valentine 2003). More recent work concluded that aphids can cause yield loss to unstressed canola, however, they need to be present on a flowering spike from flowering and that aphid control when 20-50% of flower spikes were infested prevented yield losses (Micic 2015).
Infection with virus, of particular concern is green peach aphid (GPA) transmitting beet western yellows virus (BWYV). In 2014 this virus cause widespread damage to South Australian crops and anecdotal evidence indicates an increase in the occurrence of this virus in WA. Jones et al 2007 reported yield loss of up to 50% occurred when canola plants are infected early (before flowering) and 100% of canola plants are infected. The evolution of GPA populations resistant to commonly used insecticides is a concern as poor aphid control can lead to increased virus transmission.
Method
A trial was conducted at DAFWA’s Woorree research station in Geraldton which included four treatments based on different insecticide strategies to control aphids as described below:
- Nil (no insecticide)
- One spray: insecticide applied at six leaf stage = control of aphids to stop early virus infection
- Two sprays: insecticide applied at six leaf stage and big bud stage for control of aphids until podding
- Three sprays: insecticides applied at six leaf stage, big bud stage and flowering resulting in no aphids
The design was randomised in two banks with four replicates (16 plots). Plots were 20m long by 7.2m wide. The middle 3.2m of each plot was harvested such that the outside of each plot acted as a buffer.
Several measurements were taken:
Aphid sticky traps were placed at each corner of the trial and monitored weekly to detect aphid flights. GPA, CA and winged GPA numbers were recorded from 20 plant leaves per plot weekly from 11 June-16 July. The length of CA colonisation of the inflorescence was recorded on 16 and 30 July. Leaves were sent to DAFWA plant pathology for virus testing in early July. Whole plot ratings were taken on 6 and 13 August. Establishment, total biomass production, single pant weight, and grain yield and grain quality characteristics were also recorded.
Results
Aphid numbers
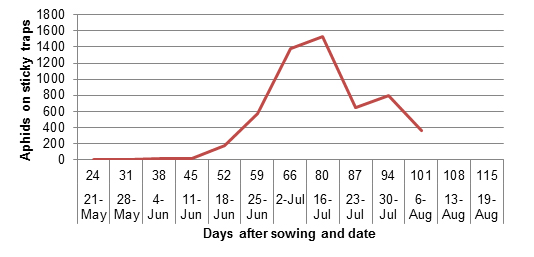
Aphids were found on yellow sticky traps from 28 May. Numbers increased rapidly from early June to the third week in July and then declined rapidly (Figure 1).
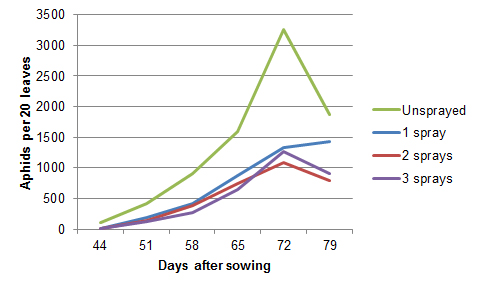
Counts of aphids on 20 plant leaves showed that the early insecticide application, 42 days after sowing was effective in reducing aphid numbers in treatments 2, 3 and 4. Aphid numbers increased in the unsprayed treatment in the same manner as recorded in the aphid traps with a sharp decrease in the population in mid-July. Aphid numbers increased in all treatments until the application of insecticide to treatments 3 and 4 at 72 DAS (Figure 2).
The species composition of the aphid population was approximately half GPA and half CA as of 16 July when leaf counts stopped. From mid-July the length of the inflorescence that was colonised by aphids was measured, and these were found to be predominantly CA. Applied treatments gave expected responses and it should be noted that aphid pressure at the site was very high; of 576 observations of spikelets taken at random only three spikelets were free of aphids. Hence this was well above the 20% and 50% spray thresholds previously reported and despite three insecticide application,s CA did colonise the three spray treatment (nil aphids), although significantly less than the other treatments (P<0.001) (Table 2).
| Treatment | 79 DAS | 86 DAS | 93 DAS |
|---|---|---|---|
| Unsprayed | 3.2 | 4.7 | 5.5 |
| One spray at six leaf stage | 2.6 | 3.8 | 4.6 |
| Two sprays: six leaf and big bud stage | 1.7 | 2.4 | 3.1 |
| Control: six leaf and big bud stage and flowering (nil aphids) | 2.1 | 1.9 | 1.8 |
| LSD | 1.1 | 0.8 | 1.2 |
| P value | P>0.05 | P<0.001 | P<0.001 |
Plant growth
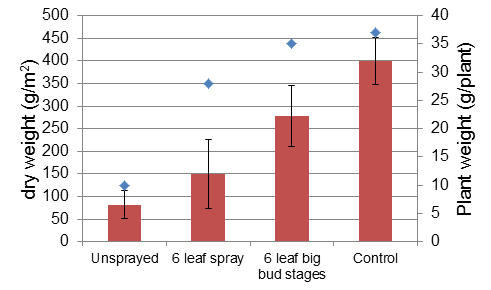
Biomass cuts confirmed our visual observations of significant differences in plant growth between treatments (P<0.001). Both total biomass and single plant weight were inversely proportional to aphid numbers observed (Figure 3).
Virus
Elisa testing of plant leaves in early July indicated that all treatments had BWYV ranging from 7.5-12% of plants infected. There was no statistical difference in percentage of plants affected between treatments.
Yield and quality
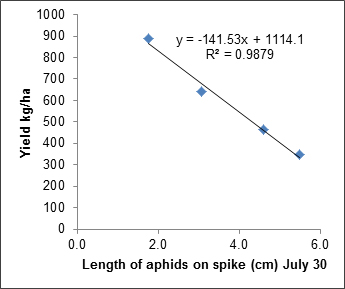
Yield was reduced when aphids were not controlled, with the unsprayed treatment yielding 39% of the control treatment. The trend was for greater yield with each additional application of insecticide although these differences were not significantly different in some cases (Table 5). The function yield (kg/ha) = -141x + 1114 where x = spike length colonised in cm explained yield loss R2 0.9 (Figure 4).
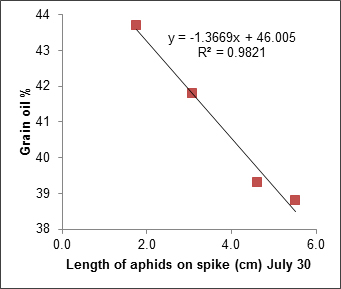
The yield results for some of the untreated plots were surprisingly high. Many plants in these plots looked almost dead in early August but a reduction in aphid landings after this time and a mild finish to the season meant that plants in this treatment re-shot and produced yield from very late flowers. Oil percentage was significantly reduced with increasing aphid pressure (Table 5). As with yield a linear relationship fitted the data y (Oil %) = -1.3669x + 46.0 where x is the average length of spikelet colonised in cm (Figure 4 and 5). Seed weight was significantly reduced with increased aphid pressure (Table 4). Again a linear relationship was a good fit, y (1000 seed weight in grams) = -0.2866x + 4.1455 R2 0.9.
| Treatment | Yield (kg/ha) | Oil % | 1000 seed weight (g) |
|---|---|---|---|
| Unsprayed | 347 | 38.8 | 2.5 |
| One spray: six leaf stage | 464 | 39.3 | 2.9 |
| Two sprays: six leaf and big bud stage | 643 | 41.8 | 3.3 |
| Control: six leaf and big bud stage and flowering (nil aphids) | 888 | 43.7 | 3.6 |
| LSD | 294 | 2.2 | 0.5 |
| P value | P<0.05 | P<0.05 | P<0.05 |
Conclusion
It is likely that the main cause of damage was from feeding by CA. The functions fitted for yield, oil, and seed weight decline by average length of spikelet colonised will be used to refine management recommendations and provide a more accurate method of assessing the requirement for management of aphid feeding damage.
The threshold for CA to cause damage to a canola plant is for 2cm or more of CA on flowering spikes, with 20-50% of flowering spikes with aphids.
In this trial nearly 100% of plants had CA and GPA. This trial has shown no yield loss from GPA feeding on seedling canola nor from virus infection. These results reinforce the need to plan ahead for aphid control. Cultural practices such as maintaining good stubble cover and establishing a thick canopy quickly to minimise bare ground and early aphid landings along with delayed sowing should be considered. Using cultural methods and only spraying with insecticides will extend the useful life of the newly registered insecticide Transform®. Also it should be noted that Transform® is registered to be used no more than twice per season to reduce the risk of resistance developing.
References
Berlandier F, Cartwright L (1998) Effect of aphid feeding damage on canola yields in 1998 Crop Updates
Berlandier F, Valentine C (2001) Further evidence that canola crops are resilient to damage by aphids Crop Updates
Berlandier F, Valentine C (2003) Aphid damage to canola - not all cultivars are equal. Crop Updates
Jones R. A. C, Coutts B. A, Hawkes J (2007). Yield-limiting potential of Beet western yellows virus in Brassica napus. Australian Journal of Agricultural Research, 58, 788–801
Micic and Wahlsten (2015). Does aphid feeding cause yield loss in unstressed determinate canola? Crop Updates
Trial number (15GE33).
