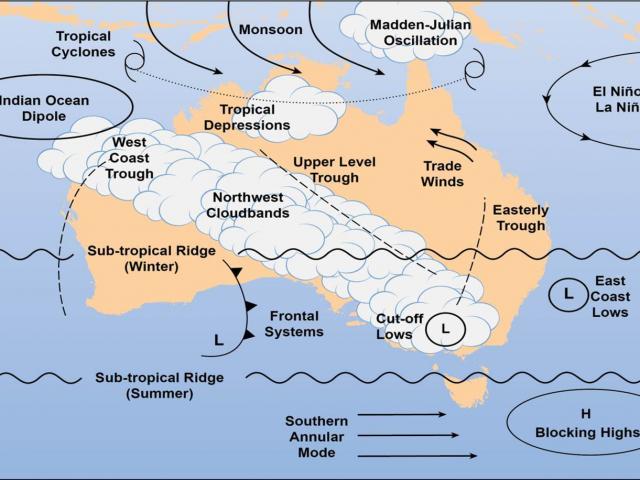
The south-west of Western Australian and the WA Wheatbelt is jointly called the South West Land Division (SWLD). The climate of the SWLD is influenced by a number of global and local climate drivers and the four main drivers are detailed in the following table:
| Climate driver | What is it? | Influence on rainfall |
|---|---|---|
| Sub-tropical ridge | Band of high pressure across the mid-latitudes,which moves north (equatorward) in winter and south (poleward) in summer | From November to April it can block cold fronts for days or weeks at a time. In winter it moves north, allowing cold moist air to create rain |
| Indian Ocean Dipole | Difference in sea surface temperature between western and eastern Indian Ocean | From May to October either negative (more rain), neutral, or positive (less rain) |
| Southern Annular Mode | North-south movement of the westerly wind belt that circles Antarctica. Drives cold front movement | All year |
| El Niño/Southern Oscillation (ENSO) | Ocean and atmosphere conditions of the Pacific Ocean | Limited influence, in an El Niño winter/spring rainfall can be lower than average due to a weaker Leeuwin current |
Sub-tropical ridge
The sub-tropical ridge runs across a belt of high pressure that encircles the globe in the middle latitudes. It is part of the global circulation of the atmosphere. The position of the sub-tropical ridge plays an important part in the way the weather in Australia varies from season to season.
During the warmer half of the year in southern Australia, the sub-tropical ridge is generally located to the south of the continent. High pressure systems, which are associated with stable and dry conditions, generally move eastwards along the ridge. Conditions along the ridge, under the influence of the high pressure systems dry and descending air, tend to be stable and drier.
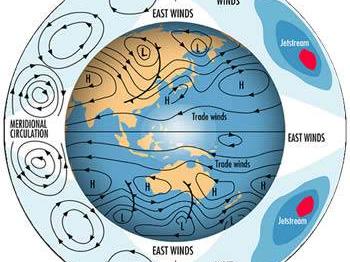
During the warmer part of the year (November-April) in southern Australia, the ridge is located to the south of the continent. During this time, the high pressure systems (also called anticyclones) along the ridge tend to suppress (cold) frontal activity. This means that any cold fronts that do penetrate the ridge generally tend to be weaker and the weather (such as rainfall, temperature and wind) associated with these systems is generally less intense than during winter (when the ridge is further northward).
In autumn, the sub-tropical ridge moves northward and remains over the Australian continent for most of the colder half of the year in southern Australia (May-October). As southern Australia cools and winter approaches, the sub-tropical ridge moves northward over central Australia. As the ridge moves over inland Australia, cold fronts associated with low pressure systems begin to extend further into southern Australia. These winter cold fronts are associated with colder southwesterly winds and showery conditions.
Indian Ocean Dipole (IOD)
The Indian Ocean Dipole (IOD) is defined by the difference in sea surface temperature between two areas (or poles, hence a dipole) – a western pole in the Arabian Sea (western Indian Ocean) and an eastern pole in the eastern Indian Ocean, south of Indonesia. The IOD affects the climate of Australia and other countries that surround the Indian Ocean Basin and is a significant contributor to rainfall variability in this region.
The IOD is one of the key drivers of Australia's climate and can have a significant impact on agriculture because events generally coincide with the winter crop growing season, as the IOD can be operational between May and November. The IOD has three phases: neutral, positive, and negative. Events usually start around May or June, peak between August and October, then rapidly decay when the monsoon arrives in the southern hemisphere around the end of spring.
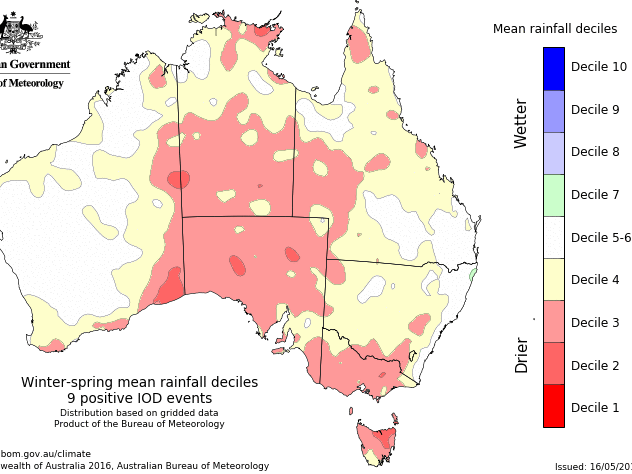
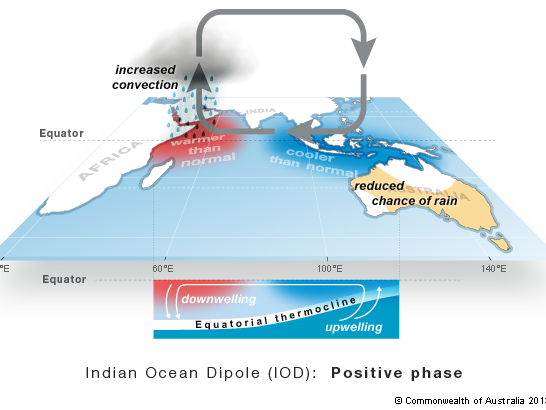
When the dipole is in a positive phase, SSTs around Indonesia are cooler than average while those in the western Indian Ocean are warmer than normal. There is an increase in the easterly winds across the Indian Ocean in association with this SST pattern, while convection in areas near Australia reduces. This results in suppressed rainfall over the Australian region, with decile 3-4 rainfall for the SWLD.
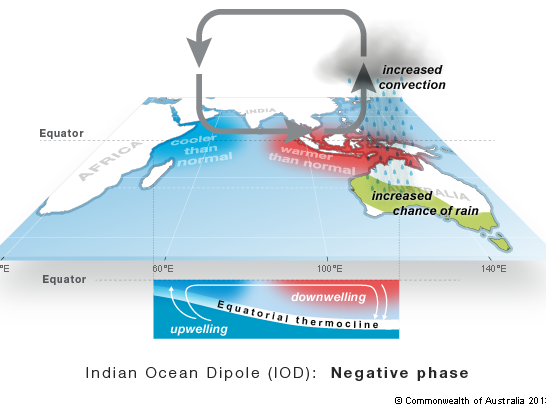
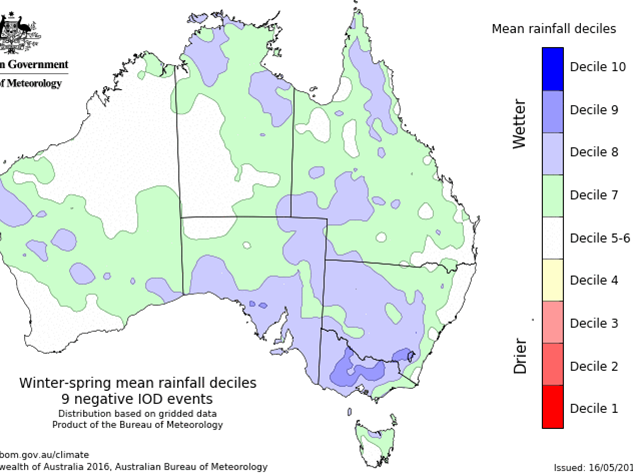
Conversely, during a negative phase, there are warmer than average SSTs near Indonesia and cooler than average SSTs in the western Indian Ocean, resulting in stronger westerly winds across the Indian Ocean, greater convection near Australia, and enhanced rainfall in the Australian region. In a negative IOD, the eastern Wheatbelt may experience higher than normal rainfall due to an increase in the number of cloud bands.
Southern Annular Mode (SAM)
The Southern Annular Mode (SAM), also known as the Antarctic Oscillation, is a mode of variability which can affect rainfall in southern Australia. The SAM refers to the north-south movement of the strong westerly winds that dominate the middle to higher latitudes of the southern hemisphere. The belt of strong westerly winds in the southern hemisphere is also associated with the storm systems and cold fronts that move from west to east. The SAM also has an impact on temperatures. In general, in areas where rainfall is increased, temperature is decreased; where rainfall is decreased, temperature is increased.
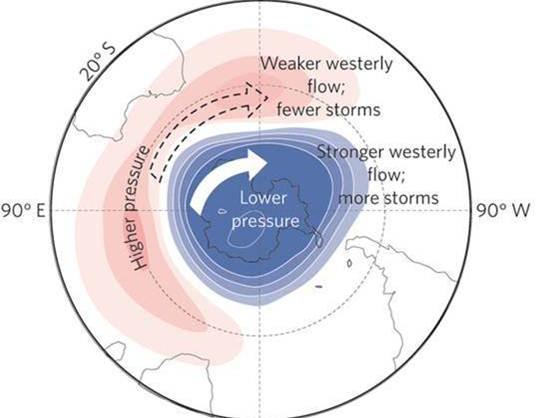
During a 'positive' SAM event, the belt of strong westerly winds contracts towards the South Pole, and thus easterly anomalies across much of southern and central Australia. This results in weaker than normal westerly winds and higher pressure over southern Australia. During winter, the easterly anomalies across southern Australia are associated with decreased daily rainfall in the southwest. The SAM explains 10–15% of the weekly rainfall variability in the south-west, which is comparable to, or larger than, the variability associated with ENSO. A postive SAM has no influence on summer rainfall in the south-west of Western Australia but can bring wetter conditions to the south-coast (Esperance) in spring.
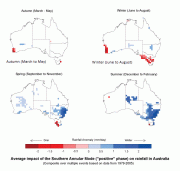
Conversely, a 'negative' SAM event reflects an equatorward expansion of the belt of strong westerly winds. This shift in the westerly winds results in more storm systems and lower pressure over SWLD in winter. A negative SAM does not influence summer and spring rainfall in SWLD.
El Niño – Southern Oscillation (ENSO)
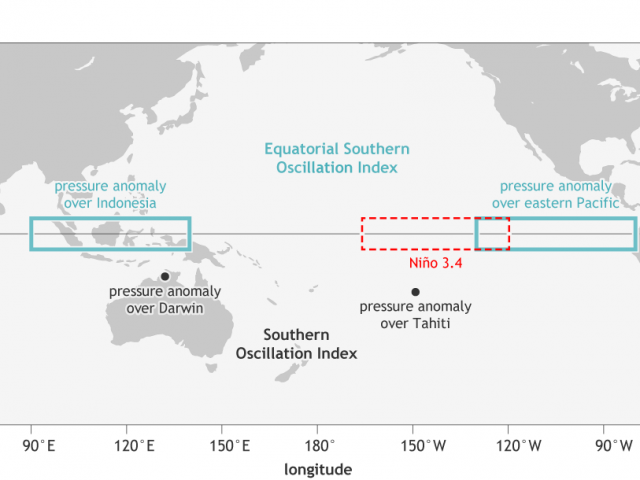
The El Niño – Southern Oscillation (ENSO) is a global scale ocean-atmosphere phenomenon involving the Southern Oscillation Index (SOI), which is calculated using the pressure differences between Tahiti and Darwin), and sea surface temperatures in the Pacific Ocean (known as the Niño 3.4 region). Three basic states exist: El Niño (significant warming in the Niño 3.4 area and a SOI value of less than -7), La Niña (significant cooling in the Niño 3.4 area and a SOI value greater than 7), and neutral.
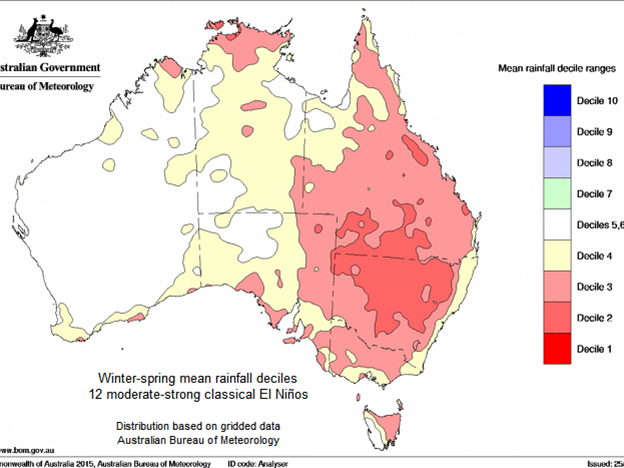
El Niños typically develop every 3-8 years and events tend to begin in autumn, mature during winter and spring, and begin to decay in summer, with the event generally ending in the autumn of the following year. El Niños usually (but not always) bring drought conditions to eastern and northern Australia in winter and spring, with limited influence to the SWLD. El Niño events normally last for around a year, however they can be shorter, or much longer.
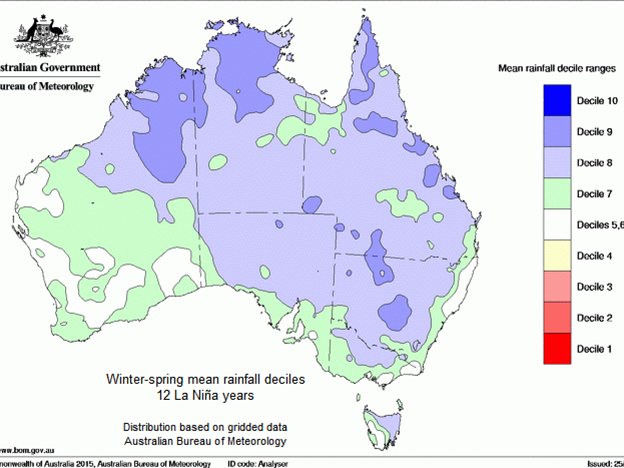
La Niñas give an increased probability that eastern and northern Australia will be wetter than normal, with limited influence on SWLD climate. La Niña events tend to begin in autumn, mature during winter, spring and early summer, and begin to decay in late summer. Events generally end in the following autumn. The greatest impact normally occurs during the winter, spring, and early summer period. La Niña events normally last for around a year, however they can be shorter, or much longer.
The influence of the drivers on seasonal rainfall
Research by Risbey et al 2009 show how the different drivers are correlated to seasonal rainfall. They found that in summer (December to February), SAM is the main climate driver for the SWLD, with the Southern Oscillation Index influencing the rainfal along the south-west coast. In autumn (March to May), atmospheric blocking, or the sub-tropical ridge, was the main climate driver for rainfall. The northern grainbelt winter (June to August) is affected by SAM, while the Great Southern and Esperance regions are influenced by atmospheric blocking. The main climate drivers of spring (September to November) rainfall include the IOD, SOI, and location of the sub-tropical ridge.
Legend of digram below: red- atmospheric blocking, yellow - southern annular mode, green - Indian Ocean Dipole, blue - Southern Oscillation Index. From Risbey JS, Pook MJ, McIntosh PC, Wheeler MC Hendon HH 2009, On the remote drivers of rainfall variability in Australia. American Meteorological Society.


