What's happening where in WA
Click on the map to view trial information in more detail:
Site management information for Dale
| Tillage type | Minimum tillage | |
|---|---|---|
| Seed bed | Burnt oat stubble | |
| Stubble loading | Low (<5%) | |
| Sowing equipment | Knife points and press wheels | |
| Row spacing (cm) | 25.4 | |
| Sowing dates | TOS 1 - 12/04 TOS 2 - 19/04 TOS 3 - 27/04 TOS 4 - 3/05 TOS 5 - 10/05 TOS 6 - 18/5 TOS 7 - 28/05 TOS 8 - 6/06 | |
| Irrigation | Water two weeks before sowing for weed germination Water the day before sowing for establishment | |
| Fertiliser applied | Pre-emergent | 100kg/ha Gusto Gold 50kg/ha Urea |
| Post-emergent | 100 L/ha UAN | |
| Herbicides applied | Pre-emergent | Barley 2.5L/ha Trifluralin 250g/ha Diuron Wheat 118g/ha Sakura 2L/ha Trifluralin 250g/ha Diuron |
| Post-emergent | 2.5 L/ha Boxer Gold 670 mL/ha Velocity | |
| Fungicides applied | Pre-emergent | N/A |
| Post-emergent | 300 mL/ha Uniform | |
| Insecticides applied | Seed treatment | N/A |
| Pre-emergent | 1 L/ha Chlorpyrifos 200 mL/ha Bifenthrin | |
| Post-emergent | Yet to applied | |
| pH | EC | |
|---|---|---|
| Grey sandy loam | 5.4 | 0.109 |
Trial information
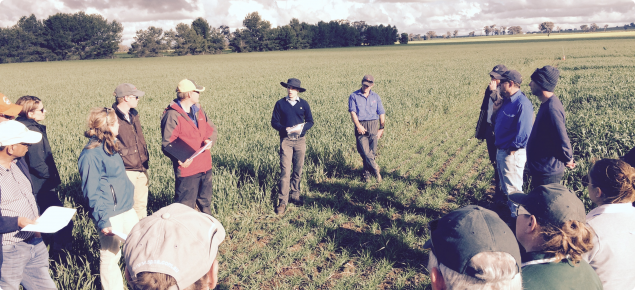
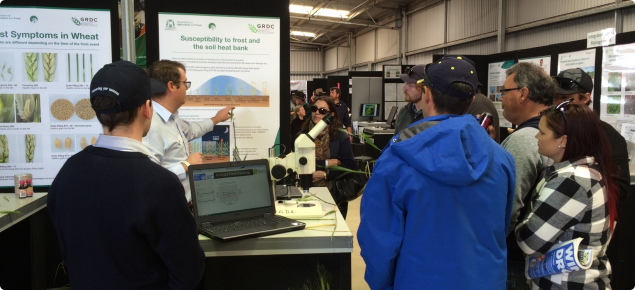
Find out more about this research at the department’s upcoming Dale Frost and Canola field day, near Beverley, on Thursday, 11 October.
Screening of frost in cereals - UA00162 - B Biddulph
Trial objectives
- To assess the genetic variation in commercial material for reproductive frost damage in commercial wheat and barley.
- Develop a rating system for frost susceptibility of commercial wheat and barley varierties suitable for use by industry.
- Screening international wheat lines with the Focused Identification of Germplasm Strategy (FIG)S for reproductive frost susceptibility
Frost tolerance in wheat - PhD project - B Leske
Crop type x time of sowing (TOS) trial - DAW00260 - B Biddulph, R Smith
Trial objectives
- Within a sowing window compare the relative frost susceptibility of wheat, barley and oats in frost prone landscapes.
- To develop across a sowing program the most stable and profitable cereal production in frost prone landscapes.
Hypothesis: Wheat is as profitable as barley and oats when phenology matches optimum time of sowing.
Nitrogen x seeding rate trial - DAW00260 - D Nicol
Hypothesis; Changing canopy density with seeding rate and nitrogen changes frost severity, duration, synchronisation of canopy development and frost damage.
Trial objectives
1. Use small plots to investigate the effect of nitrogen and seed rate on frost damage in wheat.
Intensive nitrogen x variety trial - DAW00260 - D Nicol
Hypothesis: Increasing nitrogen increases ground cover, dry matter, synchronisation of canopy tissue sensitivity to frost damage.
Trial objectives
- This trial will complement concurrent trials at other sites using larger plots investigating frost damage associated with different crop canopies and nitrogen concentration.
Debugging the role bacteria in frost management - K Ryan, B Biddulph
Hypothesis 1: Pseudomonas does increase frost damage (stem damage and floret sterility) in oats and wheat.
Hypothesis 2: A wet canopy does increase frost damage (stem damage and floret sterility) in wheat
Hypothesis 3: Ice nucleators do increase frost damage (stem damage and floret sterility) in wheat
Virtual crop walk
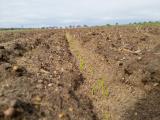
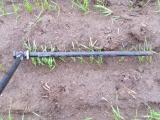
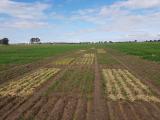
Take a virtual crop walk via our recently uploaded pictures and videos
Dale
Date: 12 April 2018
Field notes:
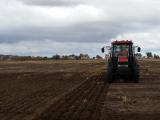
- First time of sowing going in
Date: 26 April 2018
Field notes:
- 3 TOS sown (12/4, 19/4, 26/4)
| Rainfall events | Rainfall (mm) |
|---|---|
| 22 April | 3 |
| 23 April | 4.8 |
Date: 17 May 2018
Field notes:
- 5 TOS sown
Date: 28 May
Field notes:
- Seventh TOS sown
| Rainfall events | Rainfall (mm) |
|---|---|
| 25 May | 28.6 |
| 26 May | 13.2 |
| 27 May | 1.6 |
| 28 May | 1.6 |
Date: 7 June 2018
Field notes:
| Rainfall events | Rainfall (mm) |
|---|---|
| 1 June | 5.4 |
| 5 June | 1.8 |
| 6 June | 6.2 |
| 7 June | 6.8 |
Date: 21 June
Field notes:
| Rainfall events | Rainfall (mm) | Rainfall events | Rainfall (mm) |
|---|---|---|---|
| 8 June | 0.6 | 14 June | 0.2 |
| 9 June | 6.8 | 17 June | 0.2 |
| 10 June | 2.6 | 18 June | 6.8 |
| 11 June | 0.2 | 19 June | 1 |
| 12 June | 0.4 | 20 June | 0.2 |
| 13 June | 0.2 | 21 June | 0.2 |
Date: 7 August
Field notes:
| Rainfall events | Rainfall (mm) |
| June | 65 |
| July | 102.2 |
| August (until 16 Aug) | 76.6 |
Date: 25th October
Field notes:
| Rainfall events | Rainfall (mm) |
| August | 95.4 |
| September | 11.6 |
| October | 27.2 |
Date: 11th December
Field notes:
| Rainfall events | Rainfall (mm) |
| November | 0 |
| December | 1.6 |
Follow our researchers and partners on Twitter
- Ben Biddulph, Research officer DPIRD @ben_biddulph
- Dion Nicol, Research officer DPIRD @DionNicol_WA
- Brenton Leske, PhD candidate UWA, Research officer @BrentonLeske
- Kelly Ryan, Development officer DPIRD @kelguest83
- Rebecca Smith, Research agronomist based in York @bec_jenkinson
- Facey Group Wickepin @FaceyGroup
- Kelly Angel, Research officer at BCG @kangel62
- ConsultAg @consultAg
Climate resources
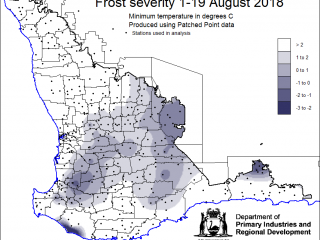
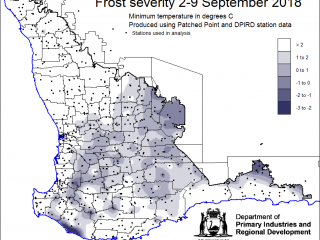
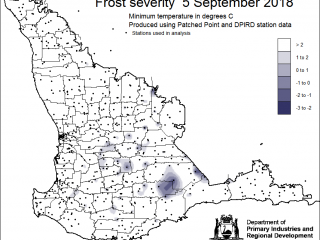
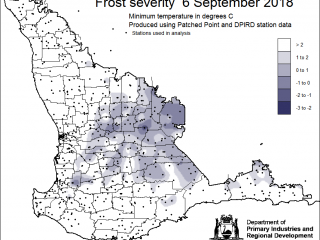
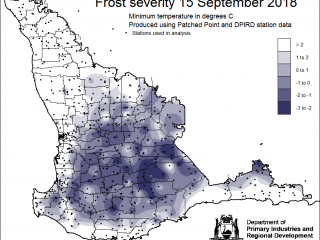
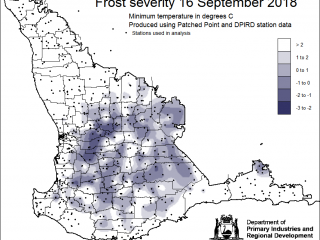
Incidence of frost varies strongly across the agricultural region, with greatest occurrence in the central, eastern and southern parts. The severity map shown below shows how cold it got.
August
September
You can use this map to get a general indication of the likelihood of frost for your area for this season. Historical frost risk maps, show the past occurrence of frost risk.
- Frost risk maps shows the average number of low temperature events occuring in the months when crops are at most risk of frost damage from 1975-2014.
- Extreme weather events tool uses data from DPIRD's extensive weather station network to map extreme temperatures, either below or above a specified threshold. It provides real-time information about the location, duration and severity of frost and heat stress events, to help grain growers manage according to reduce their financial impact.
Handy project resources and recent publications
- NEW: Frost Identification Guide for Cereals
- NEW: Frost FAQs
- PestFax Issue 2 April Sowing wheat early? Sow longer season varieties to minimise frost risk.
- In the event that you require additional support for yourself or a neighbour, please access the Think! Mental Health website which has access to check up tools and an array of resources and links to further support.
- Other useful website to access include The National Centre for Farmer Health and ifarmwell.
Investors and partner organisations
