Whole farm nutrient mapping: save $s and the environment
Whole farm nutrient mapping (WFNM) helps graziers make informed nutrient management decisions. By using soil test results, nutrient use can be optimised to increase profitability and reduce nutrient run-off to nearby waterways. The video below explains the work and one farming family's experience.
Another farmer's experience of the WFNM system
Neville Haddon, a user of WFNM, said;
“The whole farm nutrient maps are one of the most useful tools we have. We consult them often. The coloured maps are dramatic and it really hits you between the eyes. They are extremely effective at grass roots level and whoever came up with them deserves a medal. The maps showed a group of high phosphorus, high potassium, but acid paddocks around the dairy to which we have since only applied lime, nitrogen and sulfur. The economics of savings on unnecessary fertiliser is significant, and the intensity of the sampling gives us confidence. We have had no decrease in production using this strategy.”
How WFNM works
You or your adviser need to know how nutrients behave in the landscape, how to interpret soil test results for your property, and how to best use nutrient maps. This information is avaliable from WFNM workshops or other material online – see the contact at the bottom of this page.
The WFNM process is:
- collect a representative sample for every paddock on the farm
- analyse each sample for phosphorus, potassium, sulfur, phosphorus buffering index and pH
- assess the soil test data against nationally agreed critical values
- prepare colour-coded maps to assist in fertiliser decision-making
- get the nutrient delivery right
Getting nutrient delivery right
Spread fertiliser evenly across the paddock to get the best production responses. Unfortunately, not all spreaders work as indicated, and not all users set up their spreaders correctly.
We have held AccuSpread fertiliser spreader demonstration days on farms to show the difference between spreaders, the variation between how individual spreaders applied fertiliser across the paddock, and how to make changes to improve the evenness of application.
Graziers can then apply the 4Rs:
- right source
- right rate
- right time
- right place
The WFNM process has been assessed and approved as an interpretation system under Fertcare®. This means that the maps produced as part of the WFNM process will now sport the Fertcare® logo, which provides assurance that industry standards are consistently met.
Some common findings from WFNM
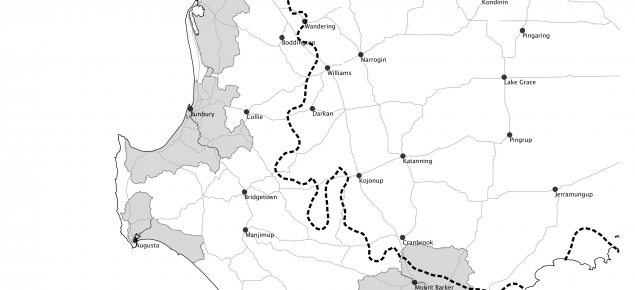
Sampling of more than 160 000 hectares within the south-west of Western Australia using WFNM principles shows some common themes:
- Phosphorus levels are higher than needed for pasture growth at 90% of maximum production on over 70% of paddocks. Those paddocks with excess phosphorus have 1.6–2.1 times the amount of phosphorus needed in the soil.
- Over 80% of tested paddocks have acid surface soils (i.e. pH <5.5 in calcium chloride in the top 10cm of soil). While this is a factor in many soil interactions, there is less of an impact on phosphorus availability than may be currently assumed.
- Over 25% of all paddocks tested were deficient in potassium, with more phosphorus than needed.
- Using the soil sulfur test, 13% were sulfur deficient while having excess phosphorus in the soil.
These results are consistent with other sampling programs undertaken throughout the south-west. This indicates that fertiliser management needs changing, with a greater emphasis on addressing limiting factors, such as acidity, and potassium and sulfur deficiency.
WFNM recommends soil testing to inform fertiliser decisions. Only apply nutrients you need and focus on the most limiting factor.
What next?
We are continuing WFNM work in partnership with the Department of Water and Environmental Regulation under the Healthy Estuaries WA program. This work is relevant to all grazing industries within the greater than 600mm rainfall zone, not only the estuarine catchments.
For more information
For up-to-date WFNM activities, visit the WFNM Facebook page.
For more details, email nutrientmapping@dpird.wa.gov.au.


