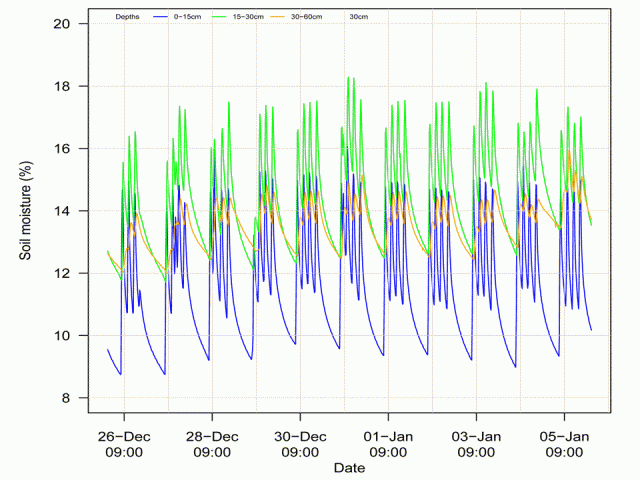
The vertical gridlines represent 9am each day and the horizontal gridlines the soil moisture percentage. The blue line is from the top 15cm, the green line 15–30cm and the orange line 40–70cm.
Expect larger rises in the top 15cm (blue line), with smaller movements in the 15–30cm layer, indicating water is being used by the crop or held in the zone above. A similar rise and fall in each layer indicates significant drainage past the first zone. The very small movement in the 40–70cm zone (orange line) indicates that a very small amount of water made it past the first and second depths as a result of irrigation over the day, not individual events. This pattern indicates low drainage and efficient use of water.
Figure 3 shows incorrect irrigation scheduling resulting in drainage beyond the root zone.
The very steep rise and fall of the blue line (0–15cm), followed almost immediately by a rise and fall in the green line (15–30cm), indicates irrigation volumes are too large and water is being pushed below the top 15cm. After a short delay, the orange 30–60cm line also rises sharply and falls between irrigations. This pattern indicates that, without significant plant water use from this zone, there is too much water for the soil to hold, and drainage results.
Soil moisture probes help determine water-holding capacity.
Another use for them is to help determine stress points or the point at which the soil profile should be refilled.
The refill point is when readily available water (RAW) has been exhausted. Beyond this point, the plant must work harder to extract water, reducing potential yield. By maintaining RAW above the refill point, plant stress in minimised and yields maximised.
Adding a logging tensiometer or gypsum block will help identify the stress point in the crop.
A tensiometer is a sensor that directly measures soil moisture tension and replicates the suction that plant roots would require to remove water from the soil. Consisting of a porous ceramic tip and a sealed, water-filled plastic tube, it can be read via a vacuum gauge or connected to an electrical circuit to allow measurements to be recorded on a data logger.
When the soil is wet, the porous tip of the tensiometer or the gypsum block allows water to move from the soil into the sensor, decreasing suction pressure or resistance. As the soil dries, water is sucked out, increasing the vacuum within the tensiometer and the resistance within the block. A reading of zero indicates saturated soil while below zero indicates a drying soil.
Soil and crop type determine the stress point within a crop. For a vegetable crop on the Swan Coastal Plain, a 15cm tensiometer should generally not exceed -5 or -6 centibars adjusted or a crop will experience water stress. On heavy-textured soils (for example clays), this figure can be as high as 30 to 35 centibars for the same crop.
Figure 4 shows a trace of a logging tensiometer at 15cm (red line) with the tension measurement in centibars (cb) on the right axis. Percentage soil moisture is shown on the left axis, as in Figures 2 and 3. The blue line is soil moisture percentage in the 0–15cm layer while the green is 15–30cm.
As water is used by the crop, the line falls rapidly from between -2.5 and -5cb to almost -20cb, indicating that plants are working hard to extract water. When irrigation is applied the following morning, the tension returns to an acceptable level.
This rapid fall indicates the stress point and therefore the level at which irrigation should be applied to avoid water stress — the refill point. In Figure 4 this corresponds to about 7% soil moisture in the top 15cm and just above 8% in the 15–30cm layer, as shown by the black lines intersecting the blue and green lines where the red line falls below -5cb.
Using this information, irrigations can be spaced to prevent tensions falling below desired levels. In crops like vines, where stress is required to increase quality, tensiometers can be used to ensure the crop receives the correct level of stress for the correct period of time.
Positioning soil moisture probes
Positioning of soil moisture probes is very important. If using drip irrigation, place sensors midway between a plant and a dripper. Probes will over estimate soil moisture if placed directly under a dripper. Place probes in a representative area of the crop and move them to different locations to confirm the reading before a final site is selected.
If irrigation is uneven, readings from soil moisture probes will not be reliable. Place a rain gauge next to the sensors at each location to compare the amount of water applied to the amount scheduled.

