Economics of the sheep enterprise
The Sheep Industry Business Innovation (SIBI) project has conducted a number of studies to help farmers better understand their costs and income base, and the costs and risks associated with adapting farming systems under increasingly variable operating conditions.
The following reports, all available for download in the side menu, contain economic research and analysis on components of the sheep enterprise that impact on farming systems.
- Comparative analysis of gross margins for grain and sheep enterprises in the central and high rain fall regions of the Western Australian (WA) wheatbelt 2016. Learn how sheep gross margins have compared with crop gross margins in the WA wheatbelt.
- Opportunities for producers to expand their sheep enterprise.
- The cost of getting back into sheep. Discover the best way to double the size of a sheep flock.
Gross margin comparisons for crop and sheep in the WA wheatbelt
Report author: Ashley Herbert, Agrarian Management
This report aimed to determine the comparative gross margins for a range of enterprises in the two main growing regions of WA: the Cereal Sheep Zone (CSZ) and the High Rainfall Zone (HRZ).
The report is based on gross margin analysis of 2011 to 2015 farm benchmark data. The data was sourced from two consulting firms: Agvise Management Consultants and Agrarian Management and was collected from clients in the CSZ (specifically in the area from Bruce Rock to Tammin) and HRZ (specifically in the area west of Katanning and Cranbrook to Kojonup) areas. The analysis is based on assessed profit in each season and includes all direct input costs.
How do average crop and sheep gross margins (2011-2015) compare?
The crop margin for each region was averaged over wheat, barley and canola crops.
The sheep margin for each region was an average sheep enterprise, producing wool and livestock sales.
In the Cereal Sheep Zone (CSZ), analysis of crop and sheep gross margins found that:
- average crop gross margin ($234/hectare) was significantly higher than sheep ($102/hectare)
- crop gross margin was highly variable between years - $102-$425/hectare (ha)
- sheep gross margin was relatively stable between years
- in two of the five years there was little difference between the two enterprises.
In the CSZ, productivity of the sheep enterprise is grossly constrained by the role pasture plays in the crop rotation. In most cases, pasture is simply an artefact of what germinates in the paddocks not cropped. The average proportion of farm cropped was 74%. For the most part, little improvement is done to pastures and fertiliser is not routinely applied. Average stocking rate in the CSZ was 3.7 dry sheep equivalents (DSE)/ha and 84% lambing over the period, while in the HRZ it was 10.2 DSE/ha and 88% lambing.
In the High Rainfall Zone (HRZ), analysis of crop and sheep gross margins found that:
- the HRZ showed considerably less difference between the crop ($370/ha) and sheep ($295/ha) enterprise gross margins than seen in the CSZ
- the sheep gross margin was variable
- there was less difference in the variability between the two enterprises compared to the CSZ.
The average proportion of farm cropped was 55%.
Variation between farms is significant
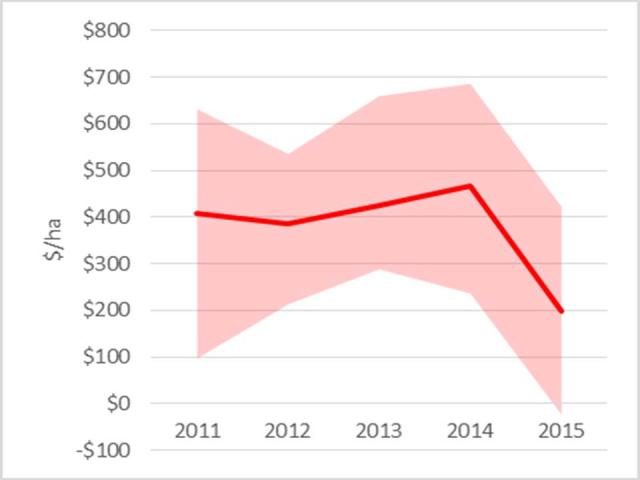
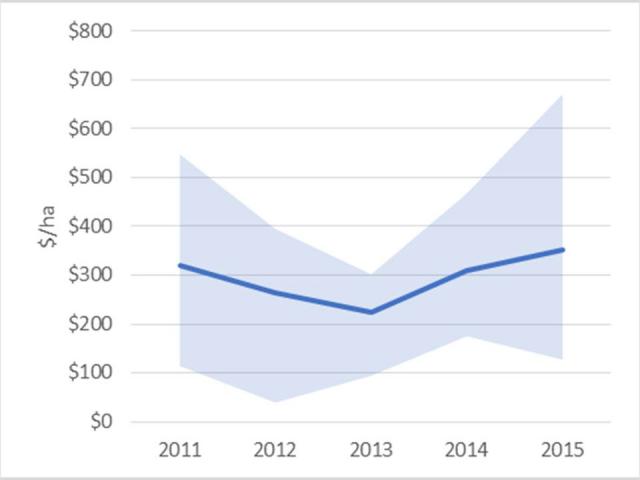
The enterprise average gross margins only provide a broad guide as to relative profitability of the farm enterprises. Group averages fail to highlight the normal level of between-farm variation in physical and financial performance. Individual performance is highly variable, and in any one year the between-farm variation far exceeds any difference between the enterprises (Figures 1 and 2, high rainfall zone).
The shaded area represents the range in gross margins for each enterprise in each year.
What were the gross margin projections for 2016?
At mid-2016, gross margins for sheep and crop enterprises in each zone were calculated based on expected costs, production and prices to be received for the 2016 season. Good seasonal conditions meant that crop yield and sheep production expectations were high, sheep and wool prices remained strong, but cereal grain prices declined. Herbicide costs were higher, while supplementary feed costs of sheep were reduced.
The CSZ projected gross margin for sheep for 2016 of $180/ha ($49/DSE) was significantly above the medium term average of $102/ha which underlined the strength of the sheep and wool markets. Crop projected gross margins per hectare were wheat ($253), barley ($167), canola ($299), and lupins ($195).
The HRZ projected sheep enterprise margin of $438/ha ($42/DSE) was approximately 50% above the medium term average of $295/ha. This highlighted the extremely profitable conditions the sheep industry was experiencing. Crop gross margins per hectare were wheat ($407), barley ($289), and canola ($528).
What is the best sheep enterprise?
Four sheep enterprises were compared to identify whether there is a ‘most profitable’ sheep enterprise.
The enterprises were:
- self-replacing Merino flock
- prime lamb (100% Merino ewe flock joined to terminal sire)
- self-replacing Merino flock with 30% ewes joined to a terminal sire
- non-specific non shearing breed.
For the comparison the enterprises were located in the HRZ, and broad general assumptions were required for the non-shearing enterprise.
The results show little fundamental difference between the enterprises.
On a like-for-like basis, the prime lamb enterprise is significantly more profitable than the typical Merino flock ($594/ha versus $438/ha). This assumes that that stocking rate, lambing rate and sale price are equal.
In reality, the two enterprises often differ. The stocking rate of a prime lamb system is reduced to allow for earlier lambing; the older ewes result in slightly higher losses and lower fleece value; and grain may be fed to carryover lambs. The net effect of these adjustments means that the prime lamb enterprise is around 10% more profitable than the Merino enterprise.
It should be noted that for the non-shearing enterprise to equal the profitability of more conventional sheep enterprises, lambing rates need to be close to 140% (of joined mature ewes). Although such lambing rates may be achieved this is only after considerable care and attention to detail has been exercised.
The performance of management is a far greater profit driver than the actual enterprise per se. With appropriate management, each enterprise can perform equally well.
Conclusions
Average 2011-2015 crop gross margins were significantly higher than sheep gross margins in both regions. There was less difference between sheep and crop average gross margins in the HRZ than the CSZ. In any one year the between-farm variation far exceeds any difference between the enterprises.
The good seasonal conditions of 2016 with the strong sheep and wool prices meant that the projected sheep gross margins in both regions were significantly higher than the 2011-2015 averages.
The 2016 projected gross margins of four different sheep enterprises in the HRZ were found to have only small differences in profitability, and there wasn’t a demonstrably 'most profitable sheep enterprise'. Profitability is highly dependent upon a wide range of variables that are equally variable between individual producers and enterprises.
Opportunities for producers to expand their sheep enterprise
Report authors: Greg Kirk and Paul Omodei, Planfarm Pty Ltd
At present prices for sheep, wool and grain in WA, sheep can match or exceed crop margins in the wool belt and western parts of the CSZ, making the sheep enterprise more financially attractive. This is a change from the past five years, when on average cropping margins have substantially exceeded sheep margins.
This report uses historical financial and production data and interviews with top sheep producers to identify opportunities for WA producers to expand their sheep enterprises.
Farm business owners seasonally allocate scarce land resources between various production enterprises. Recent historical prices in WA have favoured cropping as the dominant land use however increasing returns for sheep and wool have made the sheep enterprise more attractive.
To identify opportunities for WA farmers to expand their sheep enterprises, the Planfarm database of financial and production records from over 350 farm businesses was examined for the period 2011-2015, and 23 top sheep producers were interviewed. The analysis focused on farm businesses in the H4 (medium rainfall woolbelt), the M4 (medium rainfall cereal zone) and L4 (low rainfall cereal zone) agricultural zones.
Over the 2011-2015 period, on average cropping margins have exceeded sheep margins by approximately $100/ha for the average mixed farming operation across the survey region. This has provided little incentive for change in enterprise mix from crop to sheep and this is reflected in the overall decline in WA sheep numbers across this period.
At present prices for sheep, wool and grain, sheep can match or exceed crop margins in the wool belt and western parts of the cereal sheep zone. Cropping is still favoured in the eastern parts of the cereal-sheep zone.
While the relative future margins between sheep and crop are unknown, Australia’s dominant position in world sheep meat and wool exports, our proximity to growing Asian markets and the low sheep numbers both here and in New Zealand are positives for the sheep enterprise in the medium term.
With the financial incentive to expand the sheep enterprise now in place at least in the wool belt, the survey of top sheep producers showed that a majority (53%) planned for a modest increase (5% over five years) in the scale of their individual enterprises. Their focus was on improving production from current resources rather than a large expansion of pasture area. They were interested in new technology but more likely to invest in yards, laneways and basic infrastructure until profits were demonstrated from the use of electronic identification and other emerging technologies.
Greater focus on the sheep enterprise
The improved margins compared to cropping are likely to encourage more attention to the sheep enterprise and a focus on the key drivers of profitability. In some cases, where pasture area expands at the expense of crop, sheep production will increase disproportionately as sheep move onto better quality land which has historically been more heavily cropped.
There is still much that can be achieved by improvements in on-farm management of the average sheep enterprise with a focus on ewe management, pasture production, reducing losses, and lambs weaned per ha grazed. These opportunities exist across all regions however the impact of improved management on overall sheep numbers will be greatest in the wool belt where average flocks are larger.
Even top producers see potential for improved profitability and productivity in their own sheep enterprises through better management.
If current relativities in sheep and crop margins persist, there will be more farms where the sheep enterprise generates an equal or better margin than the crop enterprise. The benefits of a mixed farming operation have long been recognised, however too often the lower productivity and profitability of the sheep enterprise has restricted the area left out of crop.
With margins between the two much closer, there are opportunities to profitably expand the pasture area, run more sheep and as a result reap more synergistic rotational benefits such as weed control, nitrogen fixation and disease control. While such change could be transformative, producers surveyed and Planfarm clients both indicate only modest plans to expand their sheep enterprises in future.
What opportunities are there for sheep producers to expand their operation?
An increase in sheep numbers could be achieved by two means:
- a change in land use away from cropping and back to sheep production
- a change in productivity and profitability of individual sheep enterprises with or without any change in crop area.
In the wool belt, enterprise margins are such that there may be opportunities for growth in specialist sheep producers. With sheep being their major enterprise these producers are more likely to be at the forefront of driving efficiencies and profitability by adoption of new management techniques, genetics and investment in technology. There will not be a large number, but their impact on productivity could be significant.
Producers in the cereal-sheep zone see the sheep enterprise as complimentary to the crop enterprise but cropping is the priority. Practically this means sheep often graze land unsuitable for crop, and there is a big emphasis on running the sheep as 'easily' as possible. While there may be opportunities to expand sheep enterprises in this area, it is more likely producers will focus on running sheep simpler, easier and cheaper rather than necessarily maximising stocking rate.
Comparisons of key performance indicators between producers in the CSZ and the wool belt identified a ‘production gap’ that may be reflective of the low-rainfall focus on cropping. When compared to high rainfall producers, farmers in the low rainfall regions were much more efficient at turning rainfall into grain than turning rainfall into sheep products. This may indicate that low rainfall sheep producers have opportunities to expand their sheep enterprises.
There is a desire among the top producers interviewed for more transparency and competition in marketing, and 76% value highly the advice from their agents. Those producers who build relationships with buyers and processors will be better informed and more profitable as a result.
Conclusions
- Current relativities in sheep and crop margins mean that for a farm, the sheep enterprise can generate an equal or better margin than the crop enterprise. This may represent an opportunity for producers to profitably expand the pasture area to run more sheep and gain the rotational benefits of weed control, nitrogen fixation and disease control.
- The improved margins compared to cropping are likely to encourage more attention to the sheep enterprise and a focus on the key drivers of profitability.
- Due to the larger average flock size in the wool belt, percentage improvements due to better management will result in greater overall sheep numbers. Enterprise margins in the wool belt may represent opportunities for growth by specialist sheep producers.
- In the CSZ, comparison of key performance indicators (KPIs) with high rainfall producers, allowing for rainfall, suggest low rainfall producers may have opportunities to expand their sheep enterprises. The priority for cropping in this zone will likely see a maintained focus on running sheep as ‘easily’ as possible, rather than maximising stocking rate.
- Producers who build relationships with buyers and processors will be better informed.
The cost of getting back into sheep
Report author: Paul Omodei, Planfarm Pty Ltd
Download the full report including assumptions for the modelling.
Recent strengthening of lamb and wool prices has seen the profitability of sheep rival that of cropping, particularly in the high rainfall areas of the state. Demand for Australian sheep products continues to be strong, prompting farmers to consider increasing their sheep numbers.
A financial analysis was conducted of increasing sheep flock size or establishing a new sheep enterprise in High Rainfall Zone 4 of WA.
Scenarios for increasing flock size
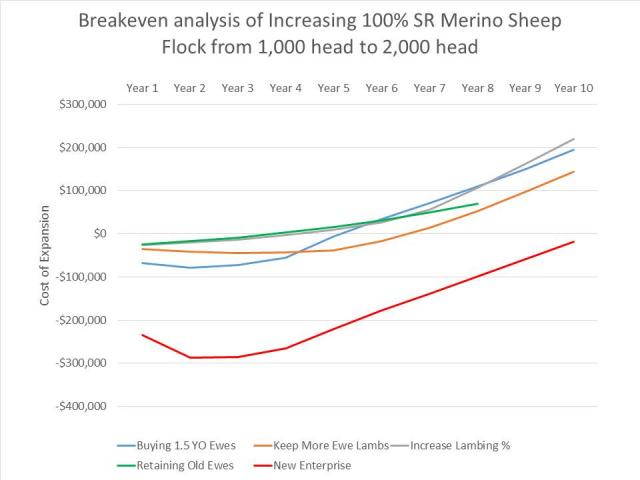
Cash-based (for the sheep enterprise) and whole-farm (including opportunity cost) analyses were conducted for the following five scenarios of increasing flock size from 1000 head to 2000 head:
- purchasing 1.5 year-old ewes
- keeping a higher percentage of ewe lambs
- increasing lambing percentage from 95% to 105%
- retaining six year-old breeding ewe cohort (CFA ewes) for an extra year
- establishing a new 2000 head flock through purchasing 1.5 year-old ewes.
Each of the above scenarios was applied to the following three flock types:
- 100% self-replacing Merino flock
- self-replacing Merino flock with 40% terminal sire
- 100% self-replacing composite breed flock.
For each flock analysis, a ‘model farm’ was designed using an average of three years of data (2013 to 2015) from the Planfarm Bankwest Benchmarks for the High Rainfall Zone 4. This zone was chosen because it represents the zone with the highest percentage of effective area grazed (48% average), a high proportion of income from those grazing operations, and there was reliable benchmark data available for Merino flocks. The available composite data was quite limited. The analysis made no allowance for poor seasons.
Producers and investors who are considering upscaling sheep production should discuss any plans for change with their farm advisor.
100% self-replacing Merino flock with Merino lambs
Modelling found that the most cost-effective option to expand a pure Merino flock from 1000 to 2000 head, with moderate debt and a reasonable time to achieve debt payback, was to increase the lambing percentage from 90% to 105% while maintaining the same number of lambs sold per hectare (Table 1).
This option compared favourably with buying ewes into an existing enterprise, retaining older ewes, increasing the number of ewe lambs retained, or starting a new sheep enterprise including essential sheep infrastructure. If the lambing percentage was increased to 105%, but the proportion of ewe lambs kept was maintained at 54%, this scenario was not feasible as the timeframe to reach a stable 2000 head flock structure was 20+ years.
| Expansion scenario | Estimated peak debt | Year that whole farm breakeven is reached | Peak livestock enterprise cash cost | Year that livestock enterprise breakeven is reached | Year that 2000 head flock size is reached |
|---|---|---|---|---|---|
| Buying 1.5 year old ewes | $78 848 (Year 2) | Year 5 | $56 868 (Year 1) | Year 4 | Year 5 |
| Keeping a higher proportion of ewe lambs | $44 234 (Year 3) | Year 7 | $37 301 (Year 1) | Year 5 | Year 9 |
| Increasing lambing from 90% to 105% | $25 459 (Year 1) | Year 4 | $27 259 (Year 1) | Year 4 | Year 7 |
| Retaining CFA (6.5year old) ewes for an extra year | $24 365 (Year 1) | Year 4 | $21 381 (Year 1) | Year 3 | >20 years |
| Establishing a new 2000 head flock by buying 1.5 year old ewes: | $287 209 (Year 2) | Year 11 | $207 768 (Year 2) | Year 6 | Year 5 |
The analysis of the effect on cumulative operating profit of the whole farm business shows that the only scenario that is significantly less than the status quo situation is the new enterprise. This is not surprising given the loss in income from reducing cropping area along with the high capital costs of purchasing ewes over the first three years. The scenario of buying 1.5 year-old ewes eventually catches up to the lower cost scenarios by Year 9.
Self-replacing Merino flock with 40% terminal sire
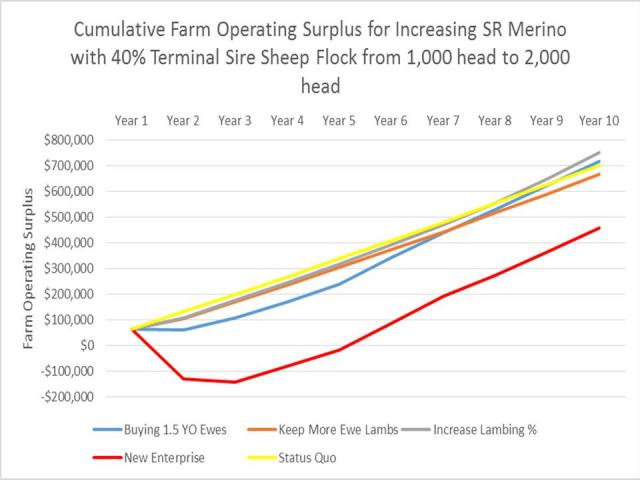
The lowest cost option for increasing a Merino with 40% terminal sire flock size from 1000 head to 2000 head was by increasing lambing percentage from 90% to 105%, and retaining 100% of Merino ewe lambs for the first seven years. The drawback to this method was that the flock size did not reach 2000 head until year 11.
| Expansion scenario | Estimated peak debt | Year that whole farm breakeven is reached | Peak livestock enterprise cash cost | Year that livestock enterprise breakeven is reached | Year that 2000 head flock size is reached |
|---|---|---|---|---|---|
| Buying 1.5 year old ewes | $80 300 (Year 2) | Year 6 | $57 928 (Year 1) | Year 4 | Year 5 |
| Keeping a higher proportion of ewe lambs | $24 264 (Year 1) | Year 5 | 25 518 (Year 1) | Year 6 | > 20 years Not a feasible time-frame |
| Increasing lambing from 90% to 105% | $20 965 (Year 1) | Year 4 | $21 777 (Year 1) | Year 3 | Year 11 |
| Establishing a new 2000 head flock | $316 033 (Year 2) | Year 10 | $200 717 (Year 1) | Year 5 | Year 4 |
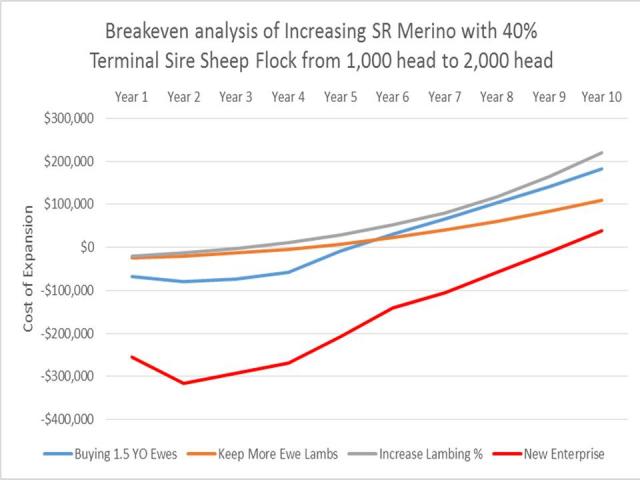
As for the 100% self-replacing Merino flock, the analysis of the effect on cumulative operating profit of the whole farm business shows that the only scenario that is significantly less than the status quo situation is the new enterprise. The scenario of increasing lambing percentage eventually surpasses the status quo scenario for cumulative whole farm operating profit by year 9.
100% self-replacing composite flock
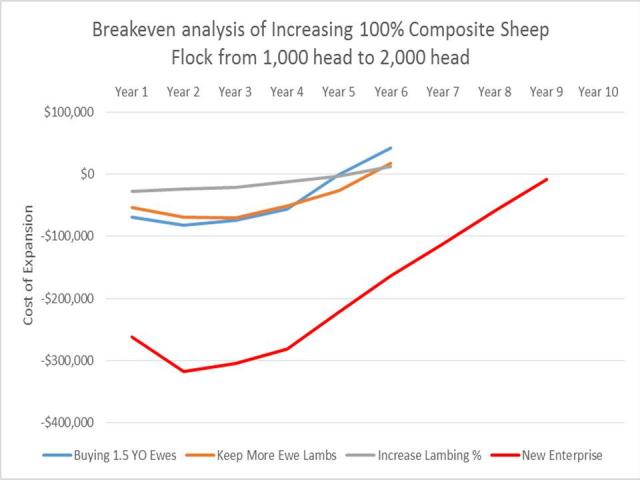
The most cost effective method of increasing a 100% composite breed flock from 1000 head to 2000 head was the purchasing of 1.5 year-old (YO) ewes or increasing lambing percentage from 12%8 to 140%, both achieving a whole farm break even in year 5.
Unlike the previous two flock types, the scenario of keeping a higher proportion of ewe lambs resulted in a significantly shorter period to reach a stable 2,000 head flock.
| Expansion scenario | Estimated peak debt | Year that whole farm breakeven is reached | Peak livestock enterprise cash cost | Year that livestock enterprise breakeven is reached | Year that 2000 head flock size is reached |
|---|---|---|---|---|---|
| Buying 1.5 year old ewes | $82 129 (Year 2) | Year 5 | $59 030 (Year 1) | Year 4 | Year 5 |
| Keeping a higher proportion of ewe lambs | $71 039 (Year 3) | Year 6 | $55 635 (Year 2) | Year 5 | Year 6 |
| Increasing lambing from 128% to 140% | $27 172 (Year 1) | Year 5 | $29 412 (Year 1) | Year 5 | Year 10 |
| Establishing a new 2,000 head flock | $317 331 (Year 2) | Year 9 | $214 199 (Year 2) | Year 5 | Year 5 |
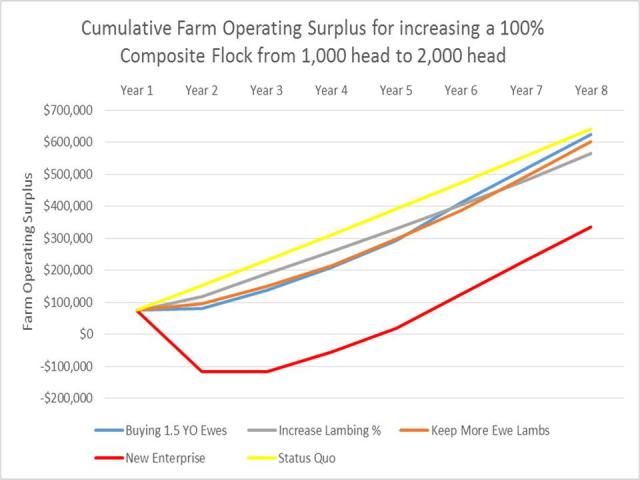
In each of the three different flock structures, increasing lambing percentage was both the lowest cost and had the shortest breakeven period. However, the downfall of this strategy is the long period taken to achieve a stable flock structure of 2000 head.
Retaining the oldest cohort of ewes for an extra year is not a strategy that can reach a stable doubling in flock size in a reasonable time frame. It is a low-cost strategy and may be an option for producers looking to increase flock size by 10-15% in a short period (less than two or three years).
Increasing lambing percentage was the only strategy with an estimated peak debt of under $30 000 and a whole farm breakeven period of under five years in all flock structures. This is in line with current industry initiatives that encourage producers to improve livestock management with the aim of increasing lambing percentage. The downfall of this strategy in this analysis is the relatively long period required to reach a stable doubling in flock size. However, this objective is probably not common amongst producers but rather a smaller target of increasing flock size by 10-30% is more likely.
Caution should be exercised when interpreting the composite scenario, as there would be few producers who could sustainably lift and maintain their weaning rate at 140%.
The three flock structures examining the establishment of a new 2000 head flock with necessary sheep-handling infrastructure had an estimated peak debt of between $287 000 and $317 000 and a whole farm breakeven period of nine to eleven years. Each flock structure reached the 2000 head flock size in five years or less. This also provides a relatively fast strategy for those producers and investors looking to ‘get back into sheep’ but is considered risky given current high market prices for stock.
Conclusions
For each flock type a different expansion method was found to be the most favourable:
- For the 100% self-replacing Merino flock, increasing lambing percentage scenario had the shortest breakeven period and reached a stable flock in seven years. Only the buying of 1.5 year old ewes reached a stable flock in shorter time of five years.
- For the self-replacing Merino/40% terminal sire flock, increasing lambing percentage scenario had the shortest breakeven period of four years. Buying 1.5 year old ewes or a new enterprise were the only expansion methods that allowed the 2000 head flock size to be reached in less than ten years. Both these scenarios were highest cost options reaching whole farm breakeven in six years and ten years respectively.
Lamb backgrounding for Western Australia
Report author: Grahame Lean, Agrivet Business Consulting
Backgrounding of lamb in Western Australia (WA) could be an intermediate market for WA lambs that have not yet achieved slaughter weights. This could even out lamb supply to processors through the year and leave more feed on breeding farms for the ewes to increase lamb production. To determine whether lamb can be successfully backgrounded, regions of Victoria where lamb backgrounding is established were compared with areas of WA.
Comparison with the Victorian industry suggests that there is some potential for the high rainfall South West region of Western Australia to background lambs, supplied with store lambs from regions like the Great Southern. This could significantly grow the lamb industry in WA due to better supply management through the year but also make the industry much bigger in total and more profitable. Forward contracts would have a role in profitable lamb backgrounding.

