Recent climate
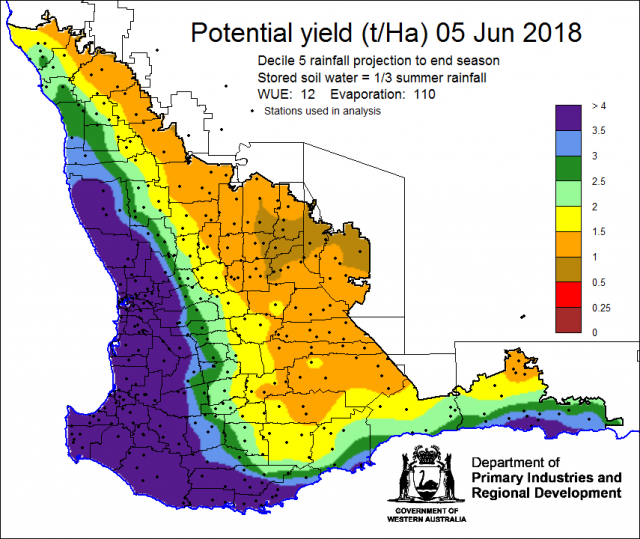
May rainfall was below to very much below average for the grainbelt. The SWLD recorded it's second driest autumn (March to May) since comparable records commenced in 1900, only behind 1914. May maximum temperatures were above average to very much above average and minimum temperatures were near average to below average. Autumn maximum temperatures were the second highest on record for the SWLD. The latest potential yield map, produced on 5 June, with a decile 5 rainfall finish indicates low yields expected in the northern and central grainbelt.
In May the atmospheric pressure was much higher than normal over southern Australia. The dry autumn was due to this higher pressure causing rain bearing fronts to be pushed south of WA until late in the month. The Indian Ocean sea surface temperatures northwest and west of Western Australia are near normal.
In the tropical Pacific, the El Niño–Southern Oscillation (ENSO) remains neutral and is expected by the majority of model to remain neutral throughout the growing season.
The Indian Ocean Dipole (IOD) is also currently neutral and four out of six models are indicating it to remain neutral until October. See the Bureau of Meteorology’s IOD and Pacific Ocean interaction for details.
The Southern Annular Mode (SAM), also known as the Antarctic Oscillation (AAO), describes the north–south movement of the westerly wind belt that circles Antarctica, dominating the middle to higher latitudes of the southern hemisphere. SAM is currently near neutral. The Bureau’s POAMA model indicates a positive SAM by mid-June. In a positive SAM event, the belt of strong westerly winds contracts towards Antarctica. This results in weaker than normal westerly winds and higher pressures over southern Australia, restricting the penetration of cold fronts inland.
When major climate drivers are at neutral values, regional rainfall may be affected by more local climate conditions rather than larger-scale features. Projections of seasonal rainfall may also be variable between different models.
The table below gives a summary of past month and three month south-west Western Australia (SWWA) climate conditions, and can be used as an indication of what is likely to occur in the near future, if climate conditions follow the current pattern.
| Climate indicator | Past month | Past three months |
|---|---|---|
| SWWA rainfall | Below average | Very much below average |
| SWWA mean temperature | Average to above average | Above average |
| SWWA atmospheric pressure | Much higher than normal | Near normal |
| Indian Ocean sea surface temperature | Near normal | Near normal |
| El Niño/Southern Oscillation (ENSO) | Neutral | Neutral |
| Indian Ocean Dipole (IOD) | Neutral | Neutral |
| Southern Annular Mode (SAM) | Near neutral | Negative |

