Rainfall update 17 October 2018
Rainfall
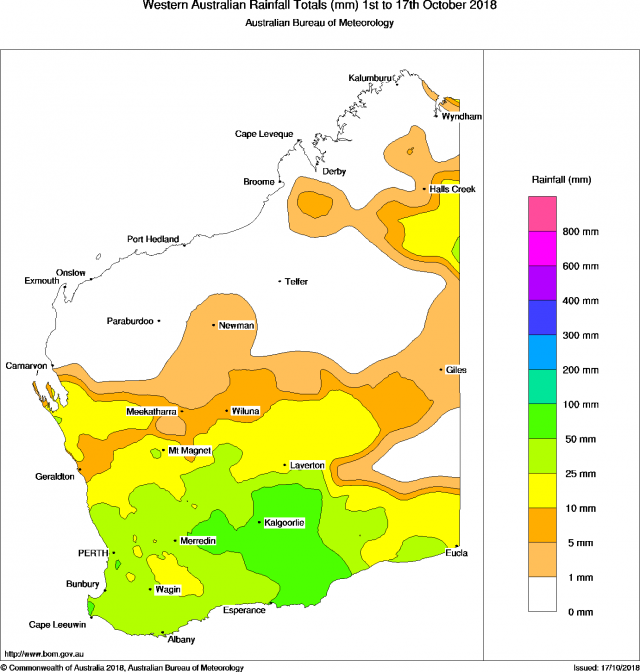
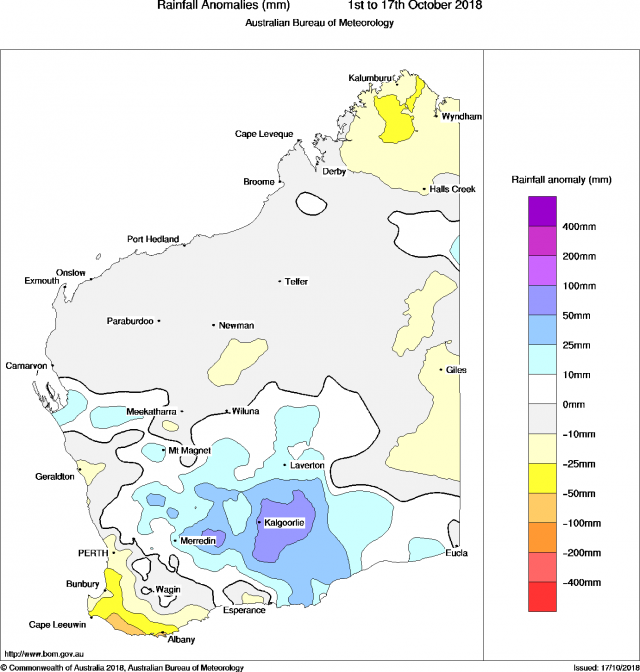
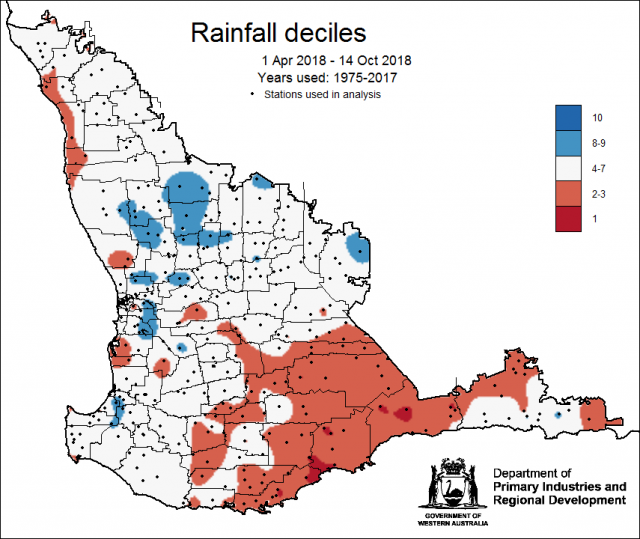
Seasonal rainfall to date decile map (Figure 1) indicates most of the south-eastern grainbelt has received decile 2-3 rainfall, while the northern and central grainbelt is tracking around average or wetter conditions to date. This comes from the dry start to the growing season, as well as good rain in early October over central parts (Figure 2). Much of the grainbelt has already achieved or exceeded average October rainfall (Figure 3).
For rainfall data from DPIRD weather stations refer to the Weather stations page. For graphs of rainfall at individual locations, see DPIRD’s Rainfall to Date tool.
Temperature
No frosts occurred over the grainbelt in the first half of October. For more information refer to DPIRD’s Extreme Weather Events tool.
Soil moisture
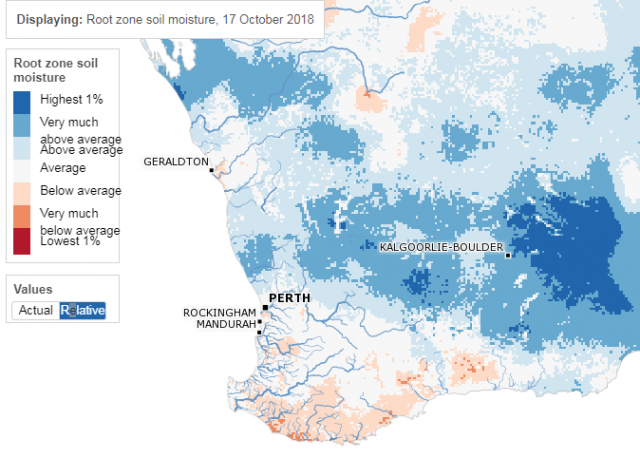
Figure 4 shows relative root zone soil water storage to 17 October 2018 from the Bureau of Meteorology’s Landscape Water Balance model. Good rain in early October has improved soil water storage for much of the grainbelt. Parts of the South West and South Coast remain with relatively low levels of soil water storage for this time of year.
For soil water estimates at individual locations with and without crop water use, see DPIRD’s Soil Water tool.
Potential yield
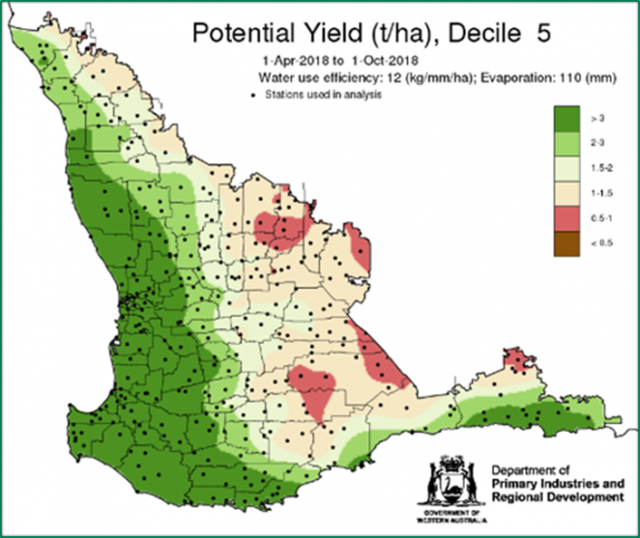
Potential crop yield is estimated using the French-Schultz relation, and uses seasonal rainfall from 1 April to 30 September (Figure 5). This model does not account for crop diseases or soil constraints.
To estimate yields at individual locations refer to DPIRD's Potential Yield tool.
Rainfall forecast
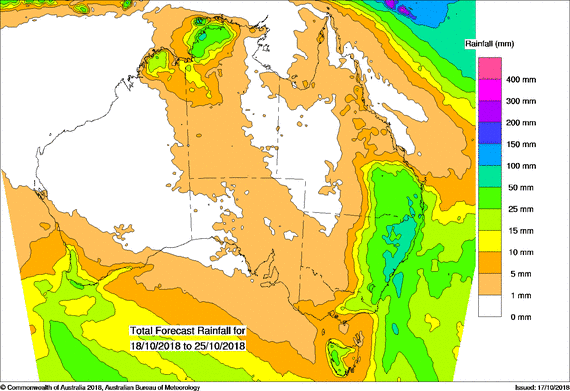
Rainfall forecast for the next week shows continuing rain for the South West Land Division (Figure 6). Most of the grainbelt is expected to receive around 5-10mm. This will support late-emerging crops and pastures, though may not be helpful for hay-making.
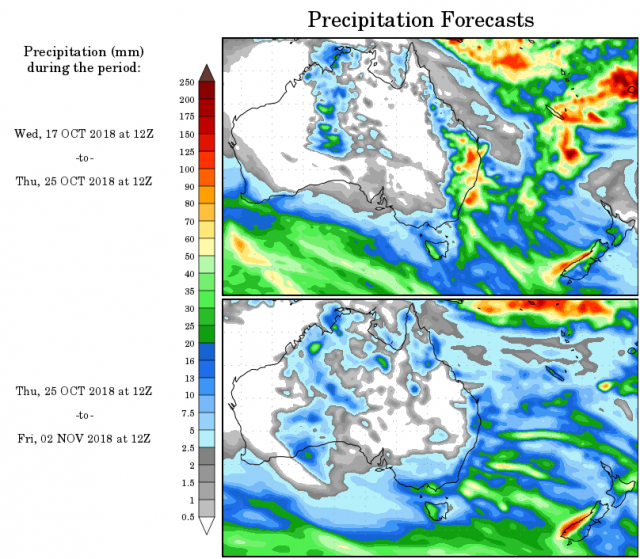
Beyond next week, the US NCEP model indicates only light rainfall for the end of October (Figure 7). Beyond then, most climate models are indicating drier than normal conditions are more likely over summer for southern WA.

