Seasonal rainfall update

Seasonal Outlook 3 October 2018

Dr Meredith Guthrie, Climate, maps produced by Anna Hepworth, e-Connected grainbelt project DPIRD

Rainfall

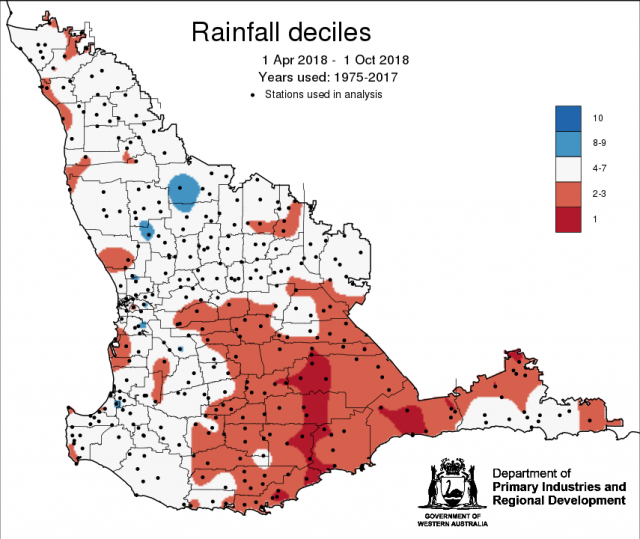
Seasonal rainfall to date decile map (Figure 1) indicates most of the southern grainbelt has received decile 2-3 rainfall, while northern and central grainbelt is tracking between decile 4-7.

Map of Western Australia showing coloured areas of rainfall decile ranks for April to September 2018
Figure 1 Rainfall deciles for April to September 2018

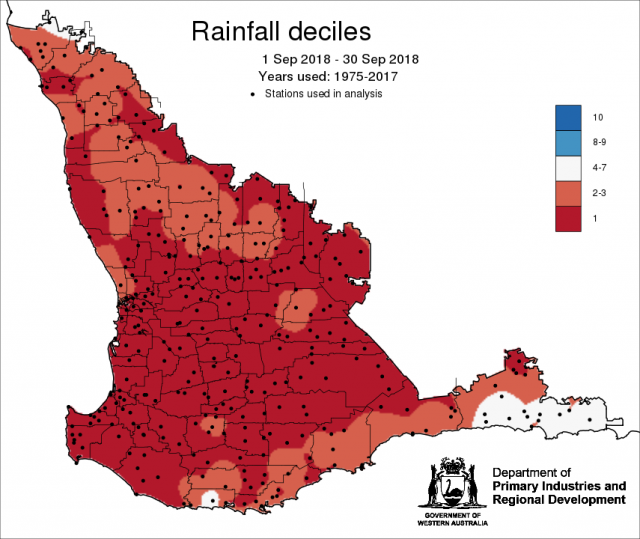
Following a wet August (Figure 2), September rainfall was well below average (Figure 3).
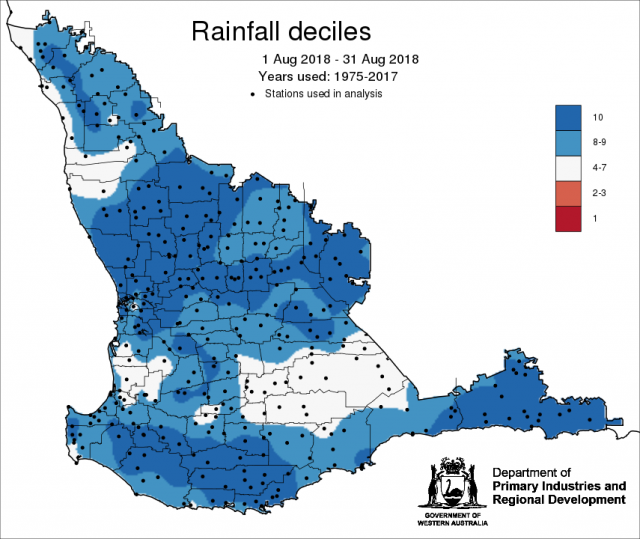
Map of Western Australia showing coloured areas of rainfall decile ranks for August 2018
Figure 2 Rainfall deciles in August 2018, indicating mostly above average rainfall for the grainbelt
Map of Western Australia showing coloured areas of rainfall decile ranks for September 2018
Figure 3 Rainfall deciles in September 2018, indicating well below average rainfall

Temperature

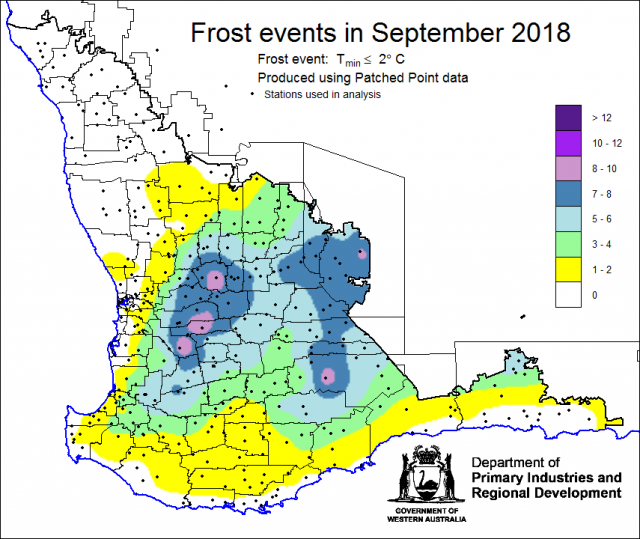
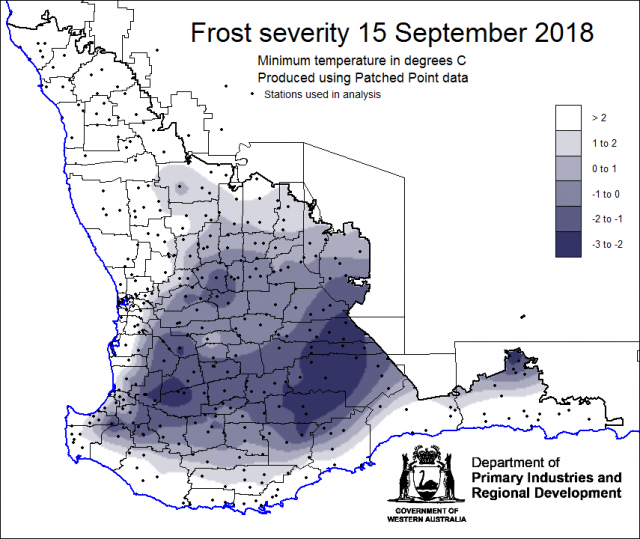
Several frost events occurred in September (Figure 4 and 5), with a severe frost event on 15 September 2018 (Figure 6).

Map of Western Australia showing number of frost events in September 2018
Figure 4 Frost events in September 2018

Individual locations recorded up to 10 frost events during September.
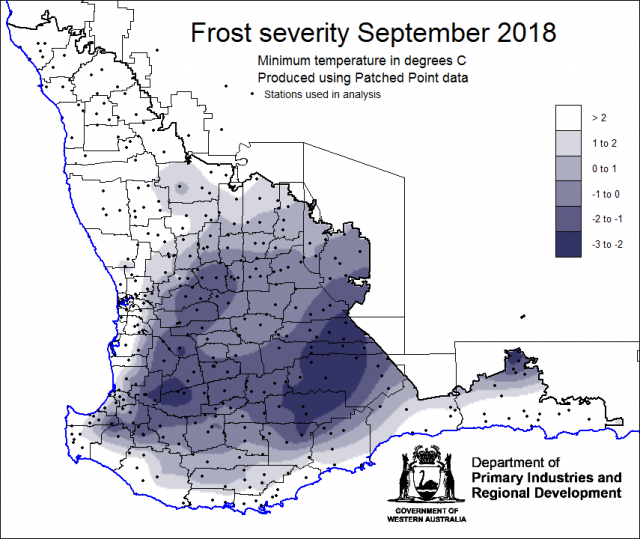
Map of Western Australia showing lowest temperatures recorded in September 2018
Figure 5 Frost severity map September 2018, with temperatures falling below -3°C in the Great Southern
Map of Western Australia showing low temperatures on 15 September 2018
Figure 6 Frost severity on 15 September 2018

Soil moisture

After a very wet August, came a very dry September, so soil water moisture levels according to the Bureau of Meteorology Landscape Water Balance model are low throughout most of the grainbelt (Figure 7).
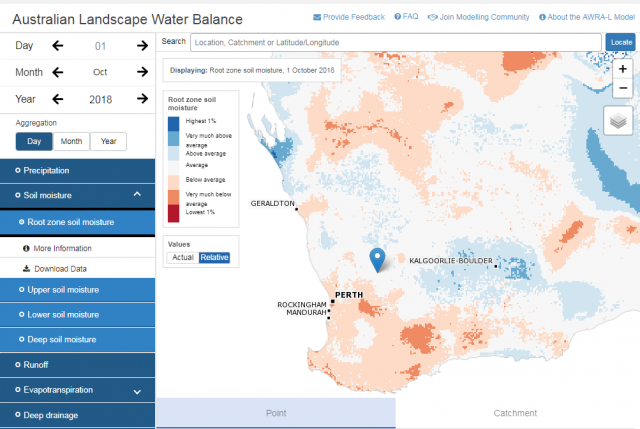
Map of Western Australia showing coloured areas of soil water storage at 1 October 2018
Figure 7 Relative root zone soil moisture at 1 October 2018, from the Australian Landscape Water Balance model (from Bureau of Meteorology)

Potential yield

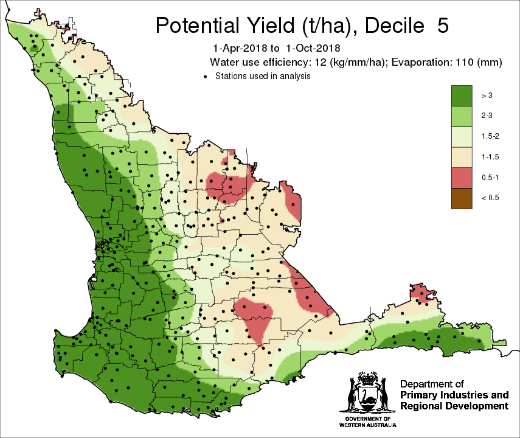
The potential yield map (Figure 8), using rainfall to 1 October, indicates lower yields expected in the eastern grainbelt and Salmon Gums area (which has also received low rainfall this year).

Map of Western Australia showing coloured areas of potential crop yield
Figure 8 Potential Yield map from 1 April to 1 October 2018 assuming a decile 5 rainfall finish

Rainfall forecast next two weeks

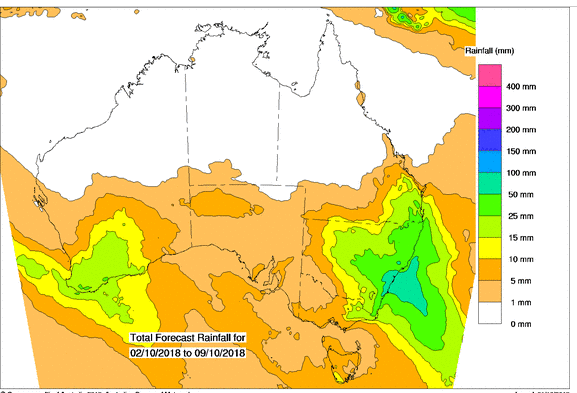
The Bureau of Meteorology’s Water and the Land rain forecast combines eight weather models, and is indicating up to 25mm for the grainbelt in the next seven days (Figure 9).

Map of Western Australia showing coloured areas of rainfall levels in millimetres
Figure 9 Rainfall forecast from the Bureau of Meteorology for 2-9 October 2018

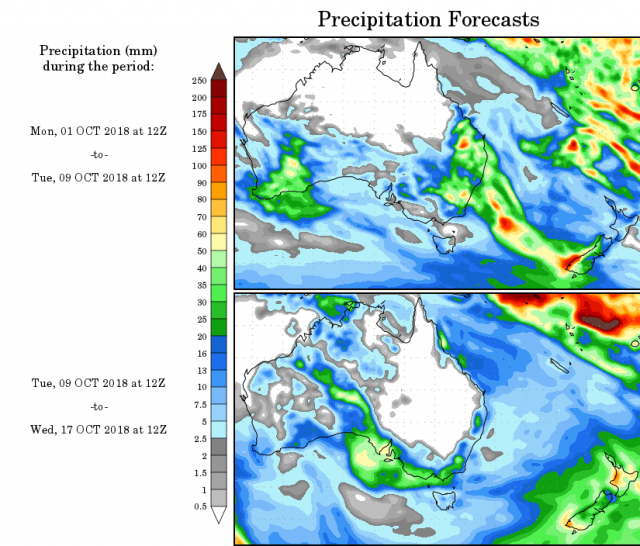
Further ahead, the US NCEP model (Figure 9) is indicating more rain, though of smaller amounts.

Map of Australia showing coloured areas of rainfall levels in millimetres
Figure 10 Rainfall forecast from the NCEP model for 1-17 October 2018

In this Issue

Seasons