Comparison of tillage methods for lime incorporation, Latham 2015 trial report

Page last updated: Friday, 3 March 2017 - 9:55am

Please note: This content may be out of date and is currently under review.

Results

Note; pH discussed as pH (1:5 CaCl2)
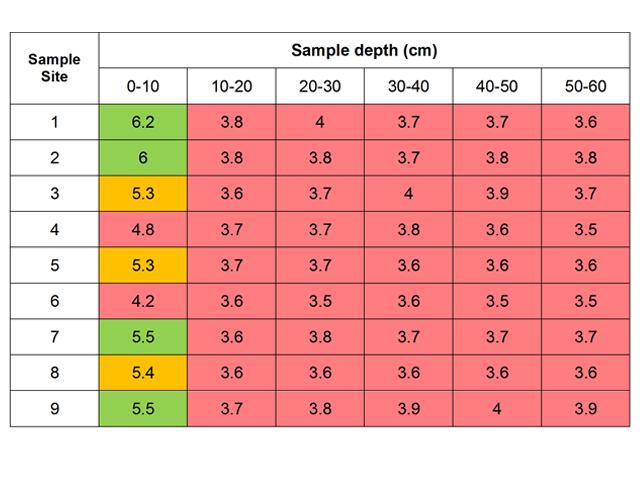
Soil pH was below target for depths of 10-60cm.  At 0-10cm 2 samples were below target pH, 3 were of concern and 4 had adequate pH
Table 1. Preliminary pH (CaCl2) of the site at Latham prior to the application and incorporation of the lime treatments.  Green cells indicate adequate pH, yellow where pH is a concern, red where pH is below target
Soil resistance increases markedly to above the critical level of 1.5MPa at soil depth of 10cm,  reaching maximum resistance of 3MPa at about 16cm.  Soil resistance then falls away with increasing soil depth to 60cm but still remains above 1.5MPa
Figure 1 Soil resistance measurement before incorporation treatments were applied achieved using digital cone penetrometer. Note: Red line at 1.5Mpa indicates the soil resistance level considered a critical point above which there is a severe impediment to penetration by the wheat roots.  This has occurred at soil depth of 10cm


Table 2 Plant counts at emergence and head counts pre-harvest. Heads per plant are estimated from these numbers
Incorporation method Plants /m2 Heads/m2 Estimated heads/plant
Nil 74 146 1.97
Cultivator point 91 163 1.75
Deep rip 68 174 2.56
Grizzly 36" offset 46 140 3.04


No significant effect on yield from lime or incorporation in the first year of the trial
Figure 2 Yield results (t/ha) for the lime incorporation trial at Blackburn, Latham (LSD; Lime – NS, Incorporation – 0.38, Lime x Inc – NS)

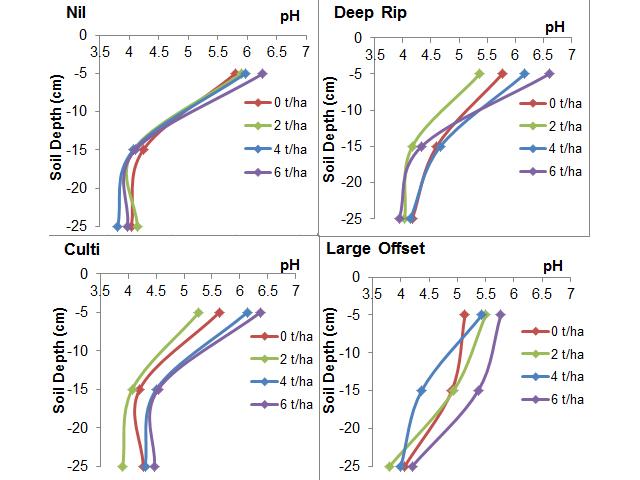
 

There is little or no increase in subsurface pH with the nil and deep rip treatments.  Lime has increase pH on the surface only.  The cultivator points and large offset disc have moved lime to increase subsurface pH at about 10-20cm
Figure 3 Soil profile results from year 1 (2015) following lime and incorporation treatments at Latham (y axis indicates depth of soil, x axis indicates pH)