How do I measure and interpret soil organic carbon results?
Changes in soil organic carbon (SOC) generally occur over many years, and it is often difficult to identify small changes.
For example, Western Australian soils have 20–160 tonnes carbon/ha (tC/ha). A typical Australian grain crop yielding 2 tonnes of wheat per hectare is likely to retain 0.1–0.5t of organic matter per hectare in the soil each year (Figure 1). This equates to a change in soil organic carbon in many instances of less than 1% of the total stock.
A larger change in total organic carbon stock, which may take several years or longer to occur, is required before a significant change could be measured with any degree of confidence. With annual inputs of organic residues likely to be less than the 0.2t C/ha in typical grain cropping systems, more than 10 years would be needed to detect a significant change in soil organic carbon.
Accurate measurement of changes in organic carbon requires:
- a soil sampling strategy that captures the natural variation in soil carbon
- a measure of soil organic carbon concentration
- an estimate of bulk density of the soil to adjust for changes in soil mass at specified depth intervals.
Changes are most likely to be observed in the topsoil (0–10cm).
Soil sampling
Sampling in a paddock
Sampling needs to capture the variability of SOC caused by:
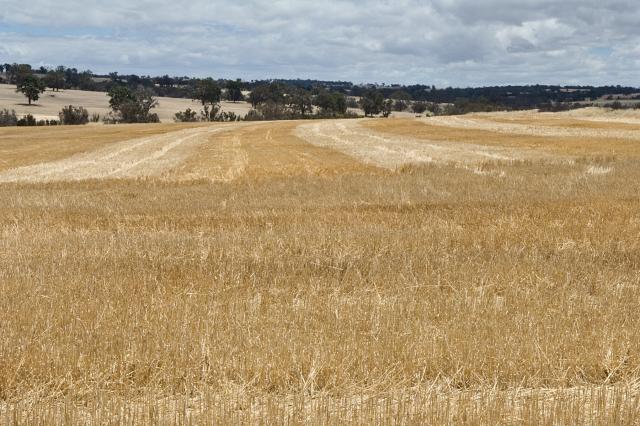
- different soil types within a paddock (Figure 2)
- variable crop or pasture history and yields across the paddock
- variable agronomy.
Typically, a minimum of 20 cores (bulked) within a sampling area is needed to adequately capture variability.
Paddocks can be zoned into several sampling areas based on soil type or properties, management history or yield potential. Position in the landscape, soil survey and farmer knowledge; land use and management history; yield maps, imagery and visual interpretation can all help determine where there is a need to soil sample.
Avoid sampling in atypical areas such as header trails, windrows, corners of paddocks, close to fences or tracked areas.
An equal (or proportional) number of samples should be taken on and off rows to determine a paddock average. Similarly, in pasture systems a representative number of samples should be taken from areas where there is poor plant establishment, as where pasture growth is high.
If traffic areas represent a significant proportion of the paddock, the sampling strategy should include samples taken on a proportional basis (that is, if 40% of the paddock is affected then 40% of samples should be taken from these areas).
It is important to collect samples representative of the average soil condition. Avoid very low, or very high yielding areas of a paddock.
It is also important not to compress the soil when pushing in a soil core, or sampling at variable depths with an auger as this will contribute to errors in estimating soil carbon levels.
Sampling depth
A large amount of the organic carbon in soil is in the 0–10cm layer and this is often where differences are seen (Figure 3).
However, sampling to 30cm provides information on changes in the location of organic carbon in soil and helps explain changes under different management practices. For example, the adoption of minimum tillage has changed the distribution of organic carbon within the soil profile - organic matter is concentrated at the soil surface and decreases at depth.
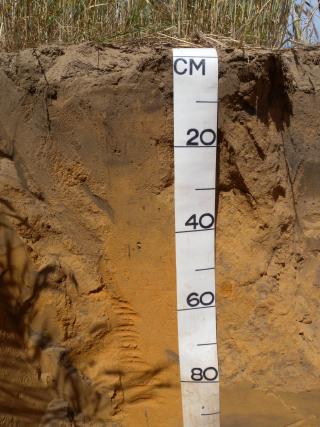
Because of this, sampling to a minimum depth of 30cm better reflects changes in carbon stocks (and is acceptable for national carbon accounts). In addition, these samples can also provide valuable information on soil nutrient status and sub-soil constraints such as low soil pH or boron toxicity. So a sampling strategy where the 0-10cm and 10-30cm layers are sampled can prove valuable.
A notable exception for depth of sampling are soils which have been re-engineered using a mouldboard plough or undergone spading for example, where the soil has experienced significant disturbance. In these situations it is advisable to sample to a depth at least 10cm below the affected depth of soil.
Time of sampling
Soil carbon varies within season, so it is important to take soil samples at the same time each year. Sampling during the non-growing phase (that is, over summer) helps to minimise the influence of plant type and growth stage on soil organic carbon, particularly in soil carbon fractions that turn over rapidly.
How much SOC is in my paddock?
Estimating bulk density to calculate SOC stocks
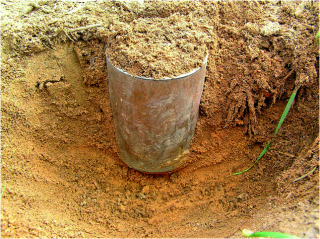
A bulk density (BD) estimate is required to calculate soil organic carbon stocks in tonnes of carbon per hectare. Bulk density is the dry weight of a known volume of soil. It can be taken using a core, exhaust tube or pipe hammered into soil for a given depth (Figure 4).
Bulk density (BD) estimate example
An exhaust tube 7cm in diameter (3.5cm radius) and banged in to a depth of 10cm has a volume of:
3.14 x (3.5 x 3.5) x 10 = 385cm3
If dry soil weight was 500g then BD = 500/385 = 1.3g/cm3 = 1 300 000kg/ha
Soil tests for organic carbon normally report a % total soil organic carbon. Using a measure of bulk density the amount of carbon per hectare in a given depth of soil can be calculated as shown.
Calculation
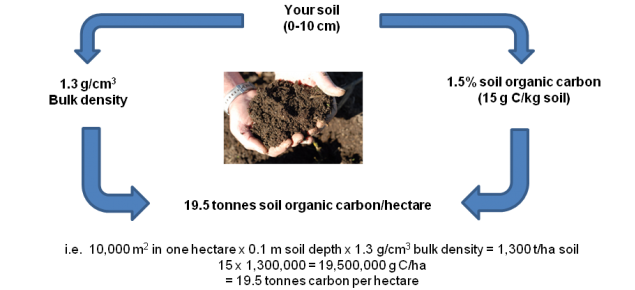
The amount of organic carbon to 10cm depth in soil with a carbon value of 1.5% and bulk density of 1.3g/cm3 is:
15 (g C/kg soil) x 1 300 000 (kg soil/ha) = 19.5t C/ha
or
1.5 x 1.3 x 10 = 19.5t C/ha
Adjusting for gravel content
If there is gravel in the soil sample, laboratory results will need to be adjusted as this is taken out before carbon analyses.
So if SOC was 1.5% but soil had 25% gravel (by volume) then: 1.5 - (1.5 x 0.25) = 1.1% SOC
Visit the Soil Quality website for a simple web based tool to adjust soil carbon results for bulk density and gravel content.
Monitoring over time
While increasing soil organic carbon is normally a slow (decadal) process and inputs must be sustained to maintain any changes, measuring carbon stocks allow us to monitor changes through time. Soils often experience changes in bulk density (BD) over time, so it is necessary to adjust any carbon stocks to an equivalent soil mass. A higher BD means a greater weight of soil for the same depth.
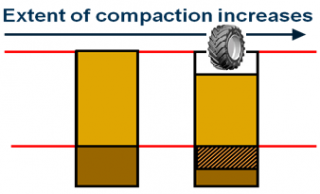
So if after five years soils were resampled and the carbon value remained the same at 1.5% but BD increased from 1.3–1.5, this value would need to be adjusted to an equivalent soil mass.
- original soil carbon stock = 1 300 000 x 15 = 19.5t C/ha
- five years on the unadjusted value suggests an increase in SOC = 1 500 000 x 15 = 22.5t C/ha
- however if adjusted for BD change = 1.3 (original BD)/1.5 (new BD) = 0.87 x 22.5 = 19.5t C/ha.
So there was no measurable change in carbon stock for the same soil mass.
How do I conduct my own field trial?
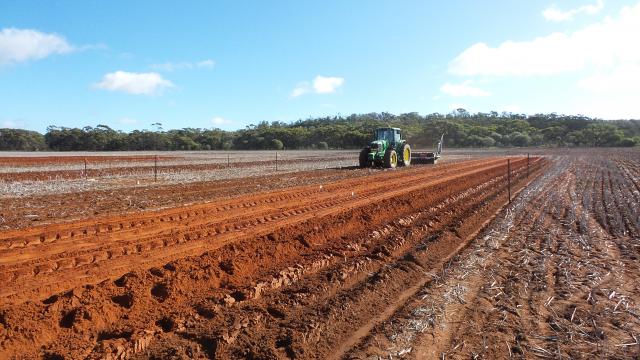
Local evaluation of new products or mangement strategies on-farm can be valuable and simple (Figure 7).
There are six basic steps in undertaking a trial or demonstration.
- Include a ‘control’ or untreated (normal practice) area in the same paddock. Results can then be meaningfully compared. Marking the plot or treated areas with pegs can save time and effort.
- Change one thing at a time within each treatment. If other factors such as fertiliser rate are changed or multiple changes are made it will be unclear which component of the product was responsible for the changes or whether it was just due to differences in fertiliser application.
- Measure something! The simplest thing to measure is often grain yield or in this case total soil organic carbon.
- Repeat treatments at least three times in the one trial, or include multiple controls across the area of paddock to be managed. Statistics can be used to exclude any differences due to changes in soil type and condition and provides a greater level of confidence that any responses measured are real.
- Keep records. Maps of the trial area, paddock history, soil type, rainfall, management and any results should be retained for future use.
- Calculate the average response for each treatment and if possible a measure of variability.

