Introduction
It is challenging to understand how water moves through soil for use by plants when we are unable to see beneath the soil surface.
Tools and techniques are available to help fine-tune your irrigation to suit the soil type, crop growth stage and root depth. These will help maximise the effectiveness of irrigation and the efficiency of your system.
Irrigation should meet the water-holding capacity for the rooting depth of the crop, with leaching only used when necessary to avoid salt accumulation in the root zone. Excess irrigation leads to water moving beyond the root zone, reducing efficiency and leaching nutrients with it.
This page explains methods to assess the spread of water from drip irrigation using dye and how this is used to help improve irrigation scheduling.
Dye test
The volume of water reaching various soil depths can be determined using moisture monitoring equipment or by adding dye to the water being delivered through the drippers.
Adding dye makes water movement more visible, especially in a wet soil. By blocking off the flow as desired, test volumes can be applied, and the depth and spread of wetting patterns seen and recorded.
The volume of water applied depends on soil type as the amounts of sand, silt and clay affect the volume of water the soil can hold. On Swan Coastal Plain sands which have extremely low water-holding capacity, volumes of 0.3, 0.5, 1, 2 and 4 litres per dripper should reach adequate depth for demonstration and comparison.
Dye can be applied to the soil directly below the dripper via a separate, dye-dosed water supply or by an injection system. Two to five millilitres per litre or 0.2–0.5% of dye by volume should be visible in the soil.
Use a non-toxic, inert dye that does not bind to organic matter such as Envirodye Blue liquid marking dye.
Procedure
Select a section of drip line that is representative of the area being tested. The area should be at a similar water-holding capacity to when irrigation is normally applied – not overly wet or dry.
Prepare an injection point for the dye and mark the areas of the bed in 5-metre sections so you can stop the flow to test the different volumes applied.
Do not run the dye trial at the end of the line because the velocity of water movement towards the end is low and dye may take a long time to move through the line.
Prepare a table showing the time required to deliver the desired amounts for each section of drip line. To do this, divide the volume required by the output of the dripper and multiply by 60 to give the run time in minutes. An example is shown in Table 1. Cells in the last two columns are blank so that results can be inserted.
Example of calculating run times
Dripper output is 1.05L/hr, drippers spaced at 25cm and range of volumes required as 0.3, 0.5, 1, 2 and 4L per dripper.
Run time = Volume required/volume delivered x 60
= 0.3/1.05 x 60
= 17 minutes
Similarly, 4L would require 4/1.05 x 60 = 229 minutes or 3 hours 49 minutes, and intermediate volumes somewhere in between as shown in Table 1.
| Volume required (L) | Run time required (minutes) | Time on | Time off | Depth (cm) | Spread (cm) |
|---|---|---|---|---|---|
| 0.3 | 17 | 8:00 | 8:17 | — | — |
| 0.5 | 29 | 8:00 | 8:29 | — | — |
| 1.0 | 57 | 8:00 | 8:57 | — | — |
| 2.0 | 114 | 8:00 | 9:54 | — | — |
| 4.0 | 229 | 8:00 | 11:49 | — | — |
Confirm the amount of water applied from each dripper by testing the application rate as described in ‘Measuring delivery of drip irrigation systems’.
Test two drippers from each test section to confirm the hourly application rate used to calculate run times.
Dye quantity required
To calculate the water or dye required for the test, follow the procedure below:
Length of test section x number of drippers per metre x volume required:
5m x 4 drippers per metre x 0.3 = 6L
5m x 4 drippers per metre x 0.5 = 10L
5m x 4 drippers per metre x 1.0 = 20L
5m x 4 drippers per metre x 2.0 = 40L
5m x 4 drippers per metre x 4.0 = 80L
Total = 6+10+20+40+80 = 156L of dye-treated water
Add 10% of extra dye in case pressure in the line increases and slightly more water is applied. So 170L of water requires 2–5mL/L or 340–850mL of dye.
Before the test, work out how to shut off sections of line.
Install taps in the line or prepare clamps to cut off the water supply during the test.
If you have added the dye to a water tank or are injecting it, flush the dye through the system by opening the end of the line. Once the end of the line is closed, start timing.
Shut off sections of drip tape from the far end to the inlet at the calculated times. The longest running section will be closest to the inlet. Shut off the system and leave the water to spread overnight.
Observing spread and depth of water
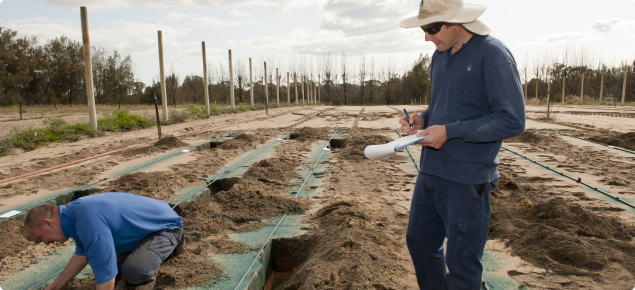
The following morning, dig a pit in each test section along the drip line. Work 20–30cm out from the line towards the line, being careful to leave a smooth face as you get towards the drip line. The blue dye should be visible.
If possible, dig on the sunny side of the drip line as sunlight will enhance the colour of the dye and show the margins more clearly.
The pit should extend over several drippers to confirm a similar movement of water within the test area. The depth of the pit will depend on the depth of the water movement but extending the pit by 5–10cm past the dye will allow a clear view of the pattern.
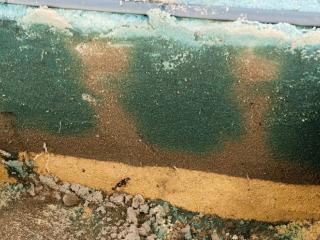
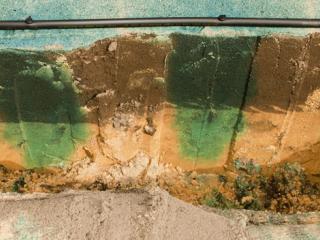
Record the average depth and spread from each volume delivered in Table 1. Photographs can be used as a reminder of the pattern observed. Examples of these can be seen below.


Using the information
The dye test shows the water application required to reach a certain depth and spread within the soil.
If the effective root zone for the crop is known, the ideal spacing between drippers can determined so that applied water meets between drippers without need for over-irrigation.
More irrigation than necessary is often applied to try and force the water to spread, but depending on soil type, this might cause significant drainage below the plant root zone, reducing water use efficiency.
A dye test on coarse sand showed that four times the water applied only resulted in a 3cm wider wetting pattern while moving from 25 to 68cm deep.
The second use for this information is determining the number of irrigations needed to deliver a required volume without causing deep drainage.
For example, in a tomato crop at the third tie growth stage, the root zone is about 250mm deep which, from the dye test, required more than 0.3L but less than 0.5L to reach 250mm.
If 1.2L is required for the day, four 0.3L or three 0.4L applications would meet the plants’ requirements without leaching past the root zone.
If three 0.5L applications were made, each would pass the root zone and result in the plant being under-watered due to water being applied beyond reach of the plant roots.
Logging soil moisture equipment can be used to confirm irrigation effectiveness. See ‘Soil moisture monitoring to fine-tune irrigation scheduling’.

