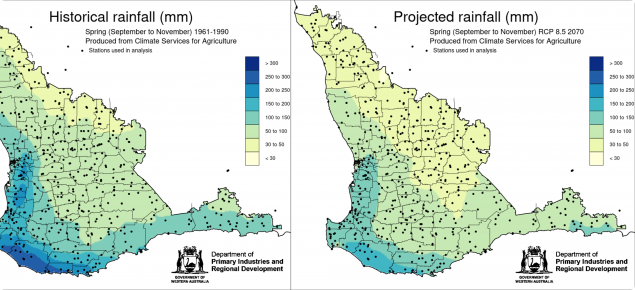
Future climate projections for rainfall and temperature are displayed as a series of maps. The data behind these projections comes from the Climate Services for Agriculture website, developed by the CSIRO and Bureau of Meteorology, to 'help farmers and communities plan for the impacts of climate variability'.
Future projections are developed using Global Climate Models (GCMs) that couple various components of the Earth's systems, including atmospheric processes, land processes, ocean temperatures and circulation, sea-ice, aerosol feedbacks and carbon cycle feedbacks. By using prescribed scenarios of greenhouse gas emissions, it is possible to estimate how quickly the Earth system will warm and model varying responses to this warming by different Earth system components (e.g. melting sea ice).
It is important to note that projections are not forecasts. They do not provide a prediction of exactly what will happen by a particular date. Instead, they draw on the best available information to indicate how the climate is likely to change based on different scenarios of human activity
Future climate projections are derived from eight GCMs from the Coupled Model Intercomparison Project (CMIP5) pool of models and is represented under two emissions scenarios, RCP 4.5 and 8.5. Greenhouse gas emissions or Representative Concentration Pathways, developed by the Intergovernmental Panel on Climate Change (RCP 4.5) assume that greenhouse gas emissions are reduced substantially by end of the century, but not enough to stop continued warming. Under RCP 4.5 adaptation will become more difficult over time. High emissions (RCP 8.5) assume rapid increases in greenhouse gases to continue towards the end of the century. Under RCP 8.5 some systems are unlikely to be able to adapt to the large changes in climate.
Rainfall maps include
- Summer (December - February)
- Autumn (March - May)
- Winter (June - August)
- Spring (September - November)
- Growing season (April - October)
- Out of season (November - March)
- Annual (January - December)
- For RCP 4.5 and RCP 8.5 for years 2030, 2050 and in some cases 2070, compared to historical rainfall 1961-1990 and current rainfall 1991-2020.
Temperature (and heat) maps include
- Anual average Maximum Temperature
- Annual average Minimum Temperature
- Annual heat risk, days above 35°C
- Days above 32°C in August-November

