Apps and Technologies Issue
Crop protection has become very challenging for growers as they need to monitor increasingly large properties.
Recent advancements and decreases in costs associated with technology are benefiting growers and consultants in the WA grains industry through rapid and improved detection (e.g. automated budworm moth trapping), diagnostics (e.g. aphid and virus detection), spray decision-support (e.g. CropScout, SnapCard, SnapBait) and reporting of insects and diseases (e.g. PestFax and MyPestGuide reporter apps).
Rapid and improved crop protection is important at the paddock scale as well as a regional scale where pests and disease development and movement can be monitored over large areas and provide an early warning. This early warning can be communicated and interpreted through media such as the PestFax newsletter and the MyPestGuide community page
DPIRD is at the forefront in developing tools for growers that improve the accuracy and decrease time and money spent on pest and disease diagnosis. These tools provide better field intelligence to assist growers to control pests and diseases when and where it’s needed and reduce unnecessary spraying and the risk of further development of pesticide resistance.
This issue of Protecting WA Crops is highlighting some of the apps developed by DPIRD (and collaborators ) and some of the other ways that technology will soon be aiding growers and consultants in the field.
CropScout
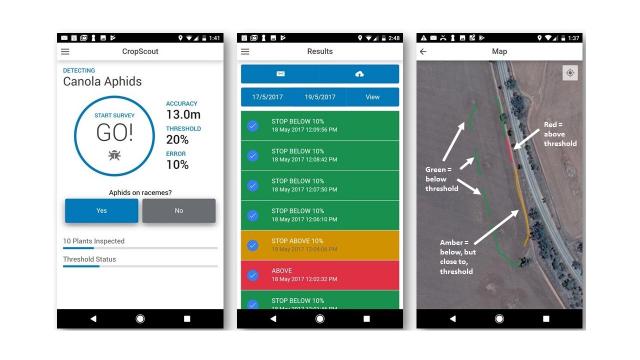
A new app, called CropScout has been developed to aid in the decision making process of whether to spray canola aphids or not. It also helps determine whether sprays can be targeted to crop edges or regions, rather than a whole paddock blanket spray
The CropScout app was released in iOS and Android stores on 31 July, 2017 as part of the MyPestGuide suite of apps from DPIRD. The app was developed by Dusty Severtson and Rob Emery and builds on Dusty’s PhD studies (with support from GRDC).
Rapid spray decision-support
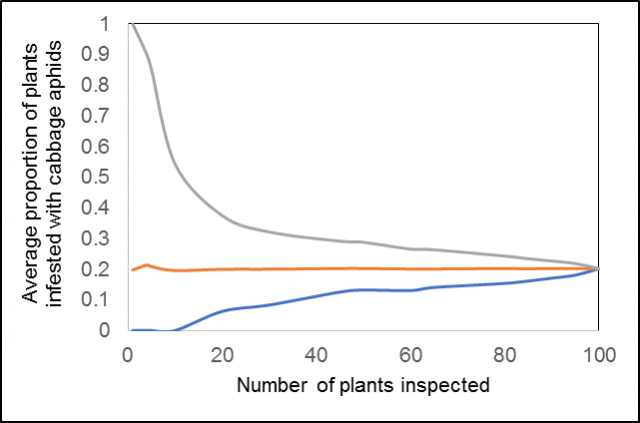
Rapid inspection of crops for pests and diseases is prone to error, resulting in either spraying unnecessarily (when infestations are overestimated) or not spraying when infested areas are overlooked or localised infestations have already caused economic damage. Figure 1 shows that average infestation levels calculated from assessments of cabbage aphids in flowering canola can easily be over or underestimated. For example, although the overall average aphid infestation levels were about 20% (i.e. 0.2 proportion) of plants infested, inspecting 10 plants could result in as low as 0% or as high as 50% estimates. Even sampling 50 plants could result in averages as low as 10-15% or as high as 30% of plants infested.
The CropScout app uses the canola aphid sequential sampling plan which is designed to decrease the number of plant inspections required to assess aphids in canola, at a set level of accuracy, relative to the spray threshold of 20% of plants infested with cabbage or turnip aphids on the racemes.
Cabbage and turnip aphids are often aggregated along crop edges where they have initially colonised the crop (unless the crop is patchy or has been moisture stressed during colonisation). The user inspects canola plants in a transect starting along crop edges, and the CropScout app automates the calculations in the background and stops when there is 90% confidence that the areas sampled are either 1) above threshold (mapped as red), 2) below threshold (mapped as green) and below but close to threshold (mapped as amber) (Fig. 2). Maps produced on the phone and on the user’s CropScout online personal page are displayed as coloured polylines, enabling a whole-paddock or multi-paddock view of where crops were inspected for aphids and what the spray threshold results were for those locations. The accuracy (error) and threshold can be changed in the settings.
The canola aphid is the first module with other modules being developed in the future, including a cereal aphid module. For more information, visit the DPIRD’s CropScout page at www.agric.wa.gov.au/apps/cropscout.
2018 Research Updates paper- Apps, traps and LAMPS: 'Smart' Improvements to pest and disease management.
SnapBait
SnapBait is a new app that is being developed by DPIRD officers Svetlana Micic and John Moore. This app will be available for free download, by the harvest of 2018.
What can SnapBait do for me?
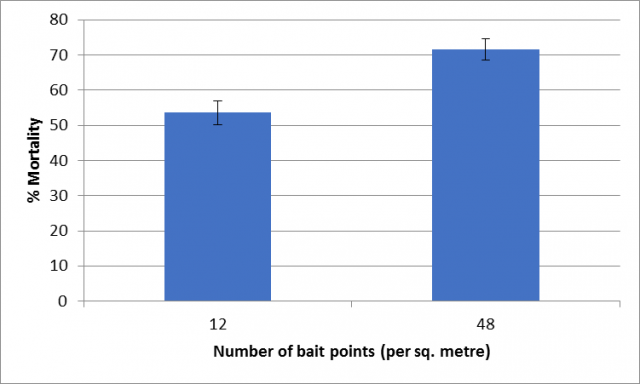
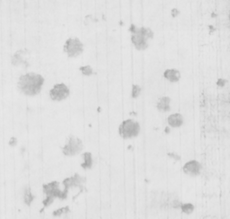
Research by DPIRD Research officer Svetlana Micic has found that an even spread of baits across a paddock increases the chance that slugs and snails will encounter a bait and feed on it, and die (Figure 3).
SnapBait has been designed to assist with bait spreader calibrations.
This app, which will be available for both Android and iPhone, is easy to use since it includes on-the-go tips and 12 sample photos to test run the functionality of the app at any time.
All you need to do is:
- Take a photo at knee-height or pick one from the gallery
- Let the app detect and count the baits
- The app will then give an estimate density of baits per square metre.
The only requirement is to have a standard size card (e.g. credit card) within the photo for the phone to have a reference of the bait size.
SnapBait has been developed to detect blue or green baits on an even background such as gravel, bitumen, concrete or level bare ground onto which the baits should be spread for calibration purposes.
We recommend taking more than one photograph along a transect. Each photo and result may be saved with date, time, GPS coordinates and you can label or add notes to each result.
SnapCard
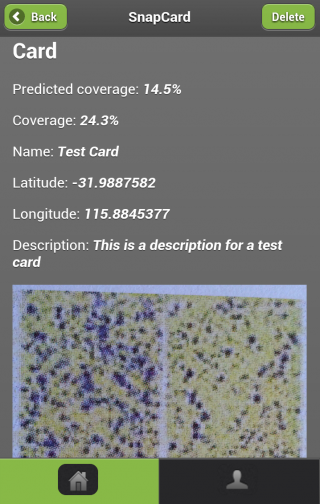
SnapCard, a free smartphone app with online interface, was developed to assist growers and crop consultants to make smarter decisions on when and how to apply pesticides most efficiently.
SnapCard was developed under a collaborative project between The University of Western Australia and DPIRD (when it was formerly known as DAFWA) with funding support from GRDC and COGGO. The app has recently been updated and connected to a new DPIRD web platform which can be viewed at https://mypestguide.agric.wa.gov.au/snapcard/
Users can operate the app without the online platform, or they can sync their results to their online account, the app is available on the App store and Google Play.
With your smartphone, you can now use SnapCard to quantify spray coverage from a water sensitive spray card. In addition you can also keep archive records of your spray settings and coverages.
Spray applications represent an important cost to grain growers. Previously there were no quantitative procedures available to estimate efficacy and performance. Simply because a crop was sprayed with an insecticide does not mean the infestation problem was solved. In fact, ineffective treatments can exacerbate growers’ problems in the long term through selection for resistance.
Often during spray applications, weather scenarios can have negative impacts on spray applications and can lead to almost zero spray deposition — so why waste the resources?
There is also a need for growers to audit the quality of spray applications conducted by contracted spray applicators. For example; were corners missed? Were spray applications conducted according to expected standards?
In short, we need to have a better understanding of how variables, especially weather variables, affect spray coverage. Then we can ensure spray applications are conducted under the most suitable conditions and are as effective as possible.
SnapCard provides growers with access to a valuable decision support tool that can be used in two important ways:
- It will predict spray coverage based on “current” conditions; time of day, tractor speed, spray nozzles, spray volume, boom height, adjuvants, and weather conditions
- SnapCard compares obtained spray coverage, measured by water sensitive spray cards, with “expected” spray coverage based on agronomic variables, weather conditions, and spray settings.
SnapCard will enable growers to predict spray coverage based on agronomic variables, weather conditions, and spray settings. You will be able to quantify and interpret obtained spray coverage giving you better pest control, reduced risk of pesticide resistance development and optimisation of spray application costs by introducing an auditable quality control procedure.
For more information refer to the SnapCard webpage.
Apps to manage Blackleg and Sclerotinia in Canola
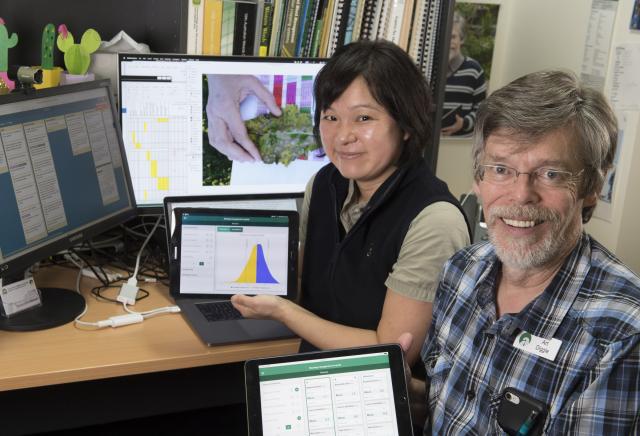
BlacklegCM is an app that has recently become available to help you manage blackleg in your canola crops. It is suitable for both iPads and Android tablets.
This app has been developed by DPIRD in collaboration with GRDC, and fellow Australian research organisations within the National Pathology Modelling project lead by Jean Galloway (DPIRD) to help you to manage the risk of blackleg in canola.
You can download it now from the App Store or Google Play and find out more information via the BlacklegCM page.
Comparing options for blackleg
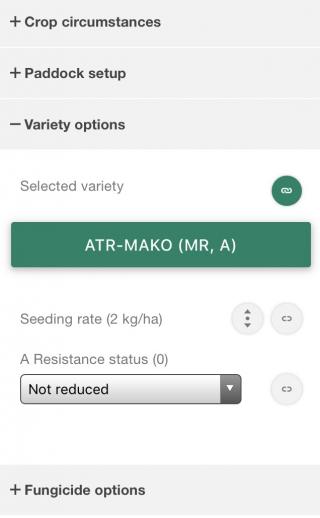
When managing your blackleg risk, lots of factors come into play. BlacklegCM allows you to easily compare fungicide options, variety choice, and options for setting up your paddock.
The app takes your situation into account by including season conditions, blackleg infection risk, amount of canola in your district, and the distance between your crop and canola stubble from past years.
BlacklegCM lets you easily compare any two management options to optimise returns and minimise risk.
It is always a gamble
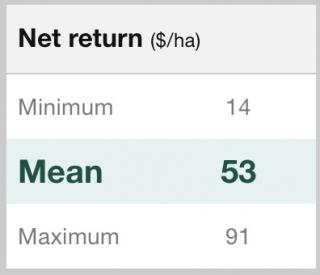
BlacklegCM always considers variability and uncertainty. The key inputs, like target yield, have a range of possible values and a most likely value. The results are put in dollar terms and are presented as the minimum, maximum and average expected outcome.
Using BlacklegCM, grain growers can make a judgement considering the average and best-case returns, and also the possible losses in the worst cases.
Which variety
When you are managing blackleg in canola, it isn’t all about the disease. You have to choose the variety that will give you the best return, and that can depend on potential yield in your area, cost of seed, grain price, seeding rate, end point royalties, herbicide tolerance, and other management costs just as much or more than the blackleg resistance rating. Blackleg CM always has the latest information from the GRDC blackleg management guide. BlacklegCM gives you an easy way to choose your variety, even when level of blackleg resistance isn’t a major issue.
For more information refer to the 2018 Research Updates paper BlacklegCM: A new app to manage blackleg in canola.
SclerotiniaCM
A sclerotinia management app is also being developed and is scheduled for release for next year’s cropping season. Like BlacklegCM, SclerotiniaCM considers the major drivers of sclerotinia, and predicts the maximum, minimum and most likely financial benefits that would result from using foliar fungicides. If you would like to test SclerotiniaCM this season, please contact Research officer Art Diggle, art.diggle@DPIRD.wa.gov.au. Further information on the development of the SclerotiniaCM app is available at https://www.agric.wa.gov.au/news/media-releases/app-being-developed-improve-canola-disease-management.
Sclerotinia Imaging System
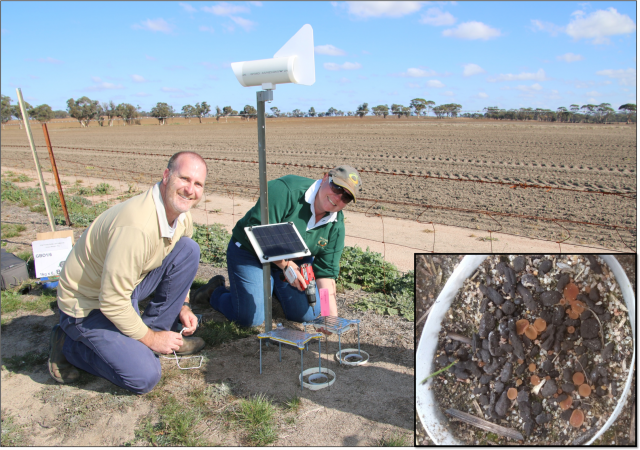
As part of DPIRD’s rapid pest and disease surveillance project, an automated imaging system was developed to monitor germinating apothecia from sclerotes to determine if it could be used as a prediction tool or early warning system for growers.
Eleven sites were selected across the grainbelt with each site containing 1 or 2 solar powered cameras. Each site was inoculated with sclerotes, and the cameras monitored their germination during the season with images uploaded every three to four hours via the mobile network. Two sites (Irishtown and Wickepin) successfully produced apothecia, and the sclerotinia monitoring cameras were successful at providing real time images of germination from remote locations.
More work is needed to improve the field inoculation methodology so sites can confidently be used as a representation of disease development in the paddock and used to model the disease so that an early warning/forecasting tool may be implemented. This, in addition to the SclerotiniaCM, will inform growers, through media, such as the PestFax newsletter, of risk scenarios and timely management of the disease during the cropping season. Further information on sclerotinia management and forecasting is available in the Protecting WA Crops September 2017 issue.
PestFax Reporter and MyPestGuide Reporter - Which app do I use to report pests with?
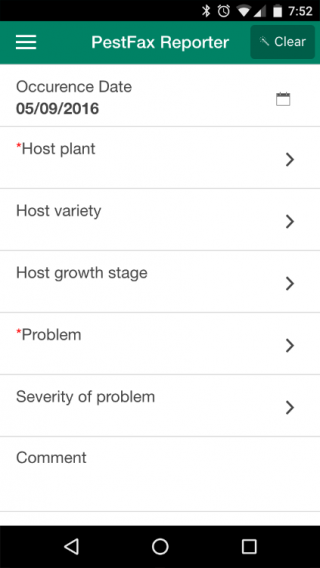
- Use PestFax Reporter to make quick reports from crop and pasture paddocks of pests, diseases, weeds and other damage. PestFax is designed for speed, tailored for crop and pasture conditions, and it reports straight to the PestFax Newsletter.
- Use MyPestGuide Reporter to report any pest from anywhere. MyPestGuide Reporter is flexible, allowing any situation to be described so that biosecurity threats of all kinds can be found quickly.
- But whichever app you use the department is grateful to receive your report and your information will get to where it needs to go
The department relies on you, the public, to report what insect, disease and weed ‘pests’ you are finding in your paddocks and homes so that we gain a picture of what is happening across WA. In return the department provides a free diagnosis of that pest and, if requested, management advice.
The department has two apps, PestFax Reporter and MyPestGuide Reporter, that are both used to report pests to DPIRD but they have different purposes. In the past there has been some confusion over which app should be used to report what. Readers can be assured that ultimately the department is grateful to receive your reports and the PestFax and MyPestGuide teams do work together and make sure that your reports end up being delivered into the relevant project and followed up if necessary.
What is the PestFax Reporter app?
PestFax Reporter users assist consultants and growers by alerting and informing the industry of what insects, diseases, weeds, or other types of damage (common and not so common) are being found in WA crop and pasture paddocks and forewarning other growers and consultants of what pest may be spreading into other farming areas. It is an easy surveillance tool for WA crops and pastures.
Non-biological damage such as frost, hail, chemical damage or water logging can also be reported via this app.
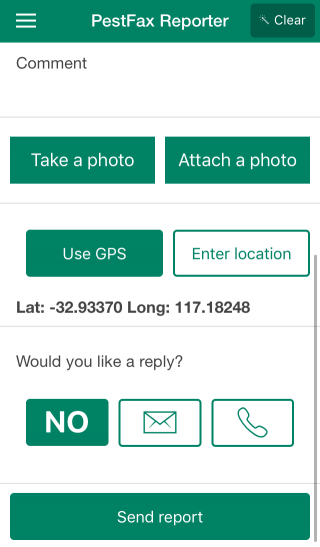
Only host (crop or pasture) and pest type are needed to make a report, but photos can be included and are always helpful, especially if assistance with diagnosis is required. The app also makes it easy to enter additional information (i.e. variety, plant growth stage, disease or insect severity, distribution across paddock) which can assist department experts with diagnosing the pest. Users can request if they want a department expert to reply via phone or email with a diagnosis and management advice, or not at all if no feedback is required.
The PestFax Reporter app works in conjunction with the PestFax map and PestFax newsletter. Reports are displayed on the PestFax map to visually display insect, disease and weed occurrences in WA. More detailed report information (occurrence, detailed pest descriptions, management advice etc) is extended via the weekly PestFax newsletter to approximately 1,000 subscribers during the growing season.
Users should be careful to download the WA version of the app (PestFax Reporter) and not the eastern states version (PestFacts Reporter).
For more information refer to the department’s PestFax Reporter page.
What is MyPestGuide Reporter app?
MyPestGuide Reporter is a free photo based reporting app built for anyone to use to quickly and easily report pests (insects, animals, weeds, or diseases) anywhere around them. Users create reports using the device’s camera, then describe the pest and its surroundings in text fields, provide contact details and submit their reports. Pest location is determined using the device’s GPS. Department experts verify the report, identify the pest, map it on the MyPestGuide community website and most importantly provide the user with feedback and advice.
MyPestGuide users strengthen and support Australia’s access to existing or new overseas trade markets by assisting the department in monitoring, managing and keeping exotic pests out of Australia. The MyPestGuide Reporter app helps support farm biosecurity, the environment and our economy by reporting the presence or absence of exotic pests.
For more information refer to the department’s MyPestGuide Reporter page.
Similarities between apps;
- They are free.
- They allow photos to be taken or attached
- Reports can be submitted outside mobile coverage or Wi-Fi range.
- The location of a report is found using a mobile device’s GPS
- Users assist experts to diagnose the pest by selecting or providing relevant descriptions about the pest and it’s environment
- Pest identification and management advice is received directly from experts to your mobile device.
- Users can agree to share their report with the public, and it is displayed on a map for all the public to view and learn about potential problems for their home or farm.
Differences between the apps;
- PestFax Reporter should be used for reporting common and unknown insect pests, diseases, weeds, or other damage in crops and pastures in WA.
- PestFax Reporter users are prompted for more detailed paddock information so a comprehensive story is built up of the situation and can be extended via the PestFax newsletter and displayed in the PestFax map.
- MyPestGuide Reporter should be used for reporting any insect, disease, or weed that may potentially be an exotic threat in any habitat in WA (including households, other buildings, gardens, or public spaces).
- When physical samples (such as leaf disease samples) are submitted using the MyPestGuide Reporter app those samples are allocated a barcode that can be tracked and assists with lab analysis and follow up.
App scenarios
A grower or consultant has found an unknown insect in their barley crop. They want to have it identified and receive management advice if it is a pest. They should use the PestFax Reporter app.
A member of the public has found an unusual wasp in their garden and are concerned that it might be a biosecurity hazard. They should use the MyPestGuide Reporter app.
Mapping rhizoctonia bare patch with Unmanned Aerial Vehicles (UAVs)
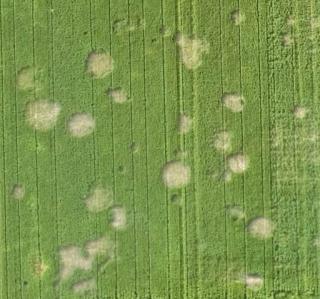
DPIRD research officers, Andrea Hills, Daniel Huberli and Geoff Thomas, have been using unmanned aerial vehicles (UAV’s) to map rhizoctonia bare patch in the Esperance area. UAVs are the perfect vehicle to map rhizoctonia root rot – on both RGB (normal) and Normalized Difference Vegetation Index (NDVI) images. The patches stand out beautifully, especially if flown before the crop runs up to head; aim to take images during mid to late tillering.
The point of generating your own map is to identify the worst affected areas for targeted treatment either by liquid in-furrow fungicide application when sowing the next susceptible crop (wheat and barley) or for cultivation.
When you have your image you can see the distribution of patches in the paddock and decide whether a targeted or blanket treatment is the best approach for that paddock. There are a number of ways you can generate a treatment map. The simplest is to import it into software such as AgLeader SMS and draw in treatment zones by eye, targeting the areas with dense and/or large patches. To add more precision to the mapping, you can manually draw in the patches across a paddock but get comfortable. Be aware that it will take a couple of days to do this for large and badly affected paddocks. This is why we are developing a program to automatically identify patches in NDVI images.
Our program, named RhizoDetector uses the roundness of patches and their relatively small size to distinguish them from other bare sections of crop caused by issues such as an early seeding bar shut off or soil issues (eg a saline area). The output is a ‘shape’ file that can be used in a number of ways; you can quantify the area actually lost to rhizoctonia, have a pleasant surprise and decide not to treat it or could generate quite precise treatment maps; for example if you have sectional liquid control, fungicide in-furrow can be applied to the patch with a buffer area around it.
For more information refer to the 2017 Research Updates paper UAV monitoring of rhizoctonia bare patches for targeted treatment.
Rapid detection by automated moth traps
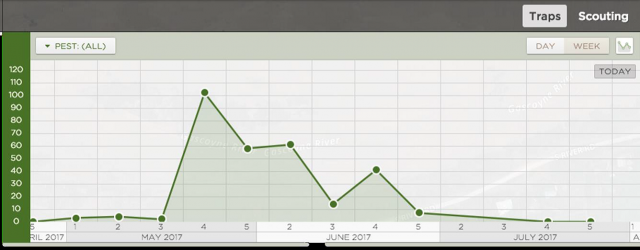
Automated traps and sensors can provide real time surveillance for pests and diseases and timely decision support of when and where crop protection practices need to be implemented.
Three types of automated trap have been used to monitor diamondback moth (Plutella xylostella; DBM) and native budworm (Helicoverpa punctigera) to assess their suitability in expanding DPIRD’s current pest trapping network:
- Spensa Z-Trap: uses a moth-specific pheromone to attract a target species and electrified pins to zap insects and record the number of ‘zaps’ that have occurred.
- ADAMA Trapview: also uses moth-specific pheromones to attract target species. The trapped moths are photographed by cameras in the trap and images are automatically uploaded to the Trapview website where they can be viewed. The Trapview website also comes with image recognition software that can determine the number of moths on the trap from the image.
- DPIRD moth trap: similar to the commercial traps, the moth trap being developed by Christiaan Valentine at DPIRD uses a pheromone to attract the target species and a camera to image moths falling into the trap. Once an image is taken, it is uploaded via the mobile network to a computer and can be checked for moth numbers.
In 2017 trials both the Z-Trap and Trapview were able to count the pests either by measuring each time a targeted insect hit the electric prongs (Z-Trap) or image recognition software (Trapview). Both traps performed well in the field and it is planned to increase the numbers of both so as to run further trials in 2018.
Two working prototypes of the DPIRD moth traps were completed and will be tested in the field during 2018. Trapping results will be disseminated to growers and consultants through media such as the PestFax newsletter.
Further reading: High-tech smart traps tested in the grainbelt
Apps, traps and LAMP's: 'Smart' improvements to pest and disease management

Rapid diagnostics tool for virus risk and early warning
Accurate detection of plant pathogens such as viruses commonly requires collecting leaf samples and sending them to a diagnostic laboratory for testing with expensive and time consuming protocols.
Using a portable and user-friendly machine that performs a diagnostic method called loop-mediated isothermal amplification (LAMP), DPIRD and others have developed and validated a protocol that enables earlier, quicker and cheaper in-field detection of Turnip yellows virus (TuYV; previously communicated as Beet western yellows virus) from leaf material and the vector green peach aphids (GPA) caught in traps. The main researcher involved in this work is Ben Congdon at DPIRD.
TuYV can be readily detected when 1 infected leaf is combined with 99 healthy ones, and when 1 viruliferous green peach aphid (GPA) is combined with 99 healthy aphids (Fig. 3). TuYV can be reliably detected by LAMP in GPA caught on yellow sticky traps or ethylene glycol pan traps and from specimens stored in 70% ethanol.
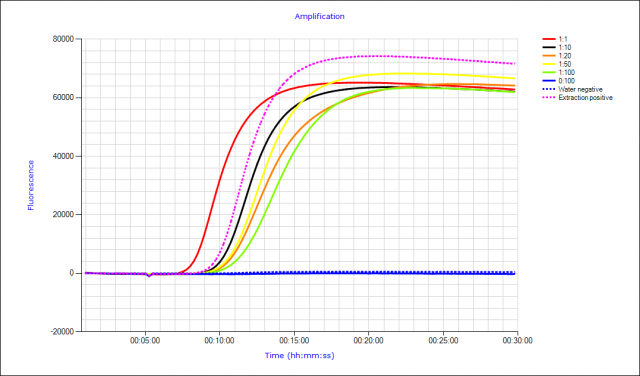
Detection of viruliferous aphids from smart traps would enable a unique advantage to disease risk forecasting. Automated pest and disease surveillance and the potential for hybridization with epidemiological modelling could provide useful forecasting and rapid decision support for growers faced with difficult and expensive crop protection issues.
Once validated for other target pathogens, LAMP will enable surveillance of a wide range of pathogens in smart-trapping programs currently being established in the WA grainbelt.
For further reading and to view 2017 trial results refer to Apps, Traps and Lamps: 'Smart' improvements to pest and disease management.

