Research Updates 2020
Each year the WA grains industry’s social calendar starts with GRDC’s Perth and regional Research Update events.
A variety of topics are presented directly to the audience but there is also a considerable body of research work that is provided to delegates in the format of written papers. These research papers are also available on the Grains Research and Development Corporation (GRDC) website for free public consumption.
This issue of Protecting WA Crops will highlight the following research papers that are available online;
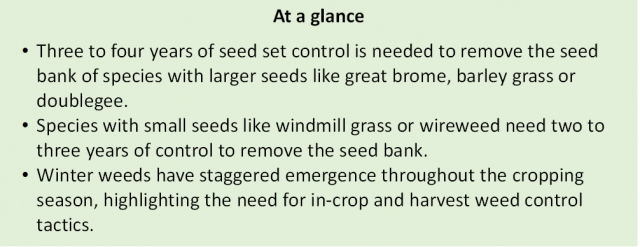
- Weed seed banks-how long do they last?
- Great brome and barley grass – modelling the long term value of harvest weed seed control
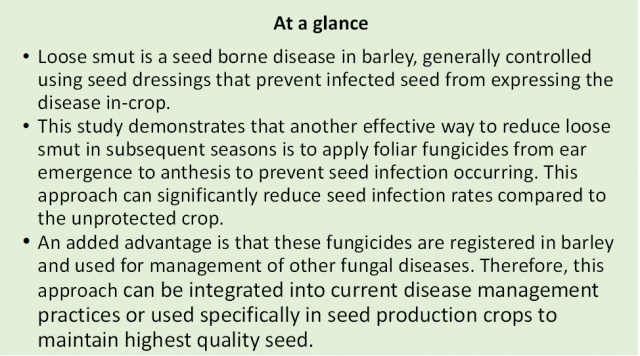
- A new approach to managing loose smut on barley
- ‘Give me a break!’ – options for paddocks infested with both root lesion nematodes and Rhizoctonia solani AG8
- Spraying for Red Legged Earth Mites may become a thing of the past
- Determining effect of lime on small pointed (conical) snail fecundity and shell strength
- Controlling small pointed snails before they lay eggs
These research papers cover the topic of crop protection but there are many other topics that have been written about and published so readers are advised to visit the GRDC's Research Updates papers webpage and investigate.
Weed seed banks – how long do they last?
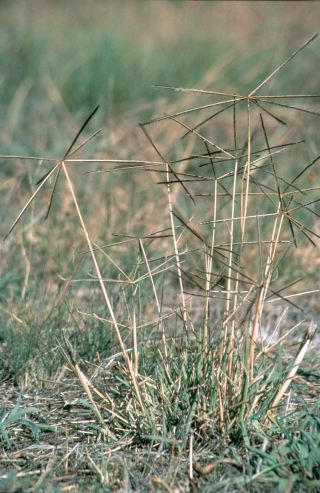
There are a range of emerging weed species in WA that are becoming increasingly common. These include barley grass, great brome, doublegee, windmill grass and wireweed. Yet we have very little information on seed bank dynamics of these species.
Research scientist Dr Catherine Borger, (Department of Primary Industries and Regional Development DPIRD), investigated weed seed banks in a field trial at Wongan Hills Research Station over a 3 year period. Seeds of two populations (collected from a crop and adjoining roadside) of great brome, barley grass, windmill grass, doublegee and wireweed were manually spread in a 1m2 area in replicated blocks. Directly after spreading the weed seeds, wheat cultivar Impress Clearfield® Plus was sown, using minimum tillage. After crop emergence and then again after each rainfall event during the 2016 season, all weeds were counted and removed. A second sowing of weed seeds was established in May 2018 using weed seeds harvested from the same areas the original seeds were sourced from. All the weeds seeds were spread directly in the trial site prior to the sowing of wheat with the exception of windmill grass which was spread after crop sowing.
For seed planted in both 2016 and 2018, emergence was generally much greater in the first year than the second and third years, and emergence of all species sown in 2016 was very low in the fourth year (Table 1). The exception was wireweed, as the seed planted in 2016 had greater emergence of both populations in the second year (2017) compared to the first year (2016). The windmill grass seed planted in 2018 on the soil surface after sowing the crop had much higher emergence than the windmill grass spread before sowing the crop and incorporated by seeding in 2016.
| Species | Population | Sown in 2016 | Sown in 2018 | ||||
| 2016 | 2017 | 2018 | 2019 | 2018 | 2019 | ||
| Barley grass | Roadside | 779.9 | 4.6 | 42.9 | 0.8 | 131.1 | 3.0 |
| Crop | 101.5 | 66.4 | 25.7 | 1.8 | 26.9 | 1.6 | |
| Great brome | Roadside | 621.0 | 128.6 | 38.2 | 8.9 | 30.6 | 40.6 |
| Crop | 701.1 | 23.4 | 6.2 | 2.1 | 117.3 | 0.0 | |
| Doublegee | Roadside | 237.6 | 9.6 | 66.1 | 2.6 | 20.2 | 11.2 |
| Crop | 467.9 | 26.6 | 77.6 | 0.7 | 134.1 | 4.7 | |
| Windmill grass | Roadside | 0.0 | 0.0 | 0.6 | 0.0 | 5.5 | 0.7 |
| Crop | 0.1 | 0.0 | 0.0 | 0.0 | 332.7 | 0.0 | |
| Wireweed | Roadside | 34.8 | 59.6 | 4.6 | 2.5 | 51.1 | 0.0 |
| Crop | 4.9 | 6.7 | 1.0 | 0.6 | 11.4 | 4.6 | |
Within an individual year, barley grass populations always emerged later than great brome (barley grass peak emergence in Jun/Jul and great brome peak emergence in May/June (Figure 1). For both species, most seedlings had emerged prior to August, but some seedlings emerged in August, September and October. Doublegee and wireweed also had staggered emergence though out the year, although wireweed emergence was low in all years.

To view the full paper refer to Weed seed banks - how long do they last? or contact Dr Catherine Borger, DPIRD on mobile +61 (0)467 816 082.
Great brome and barley grass – modelling the long term value of harvest weed seed control
Brome grass and barley grass are ranked as the fourth and ninth most detrimental weeds nationally, with an annual revenue loss of $22.5 and $1.7 million respectively. Dr Catherine Borger (DPIRD) used an updated version of the Weed seed wizard model (WSW) to investigate harvest weed seed control (HWSC). She aimed to determine if HWSC is still a valuable weed management technique even if you can only capture a low proportion of seed at harvest.
A 6 year scenario examining the long term impact of HWSC (destroying 1, 20, 40, 60, 80 and 100% of great brome or barley grass seed) was established with an initial seedbank of 100 seeds of either weed species. In the scenario, soil type was sand, weather was from Wongan Hills WA and rotation was wheat-wheat-lentil-wheat-wheat-lentil.
Great brome was highly competitive in the updated model. In the scenario where great brome was controlled by herbicide alone and a normal harvest was used (i.e. 1% of weed seed captured in the grain), the total weed seed in the soil seed bank on 1 December each year increased from 319 seeds in 2011 to 10954 seeds in 2016 (Table 2). However, HWSC of 20% of great brome seed reduced the number of seeds in the soil seed bank to 5925 in 2016. When 60% of seed was captured at harvest, total seeds in the soil seed bank in 2016 were lower than the initial starting seed bank of 100 seeds/m2.
By comparison, barley grass was not highly competitive. The seed bank reached less than 1 seed/m2 by 2014 with herbicide use alone. Increasing levels of HWSC still reduced the weed seed bank faster than the scenario with 1% HWSC.
| Year | Bromus (diandrus) | Barley grass | ||||||||||
| 1% | 20% | 40% | 60% | 80% | 100% | 1% | 20% | 40% | 60% | 80% | 100% | |
| 2011 | 319 | 266 | 210 | 143 | 125 | 42 | 28 | 26 | 23 | 21 | 18 | 15 |
| 2012 | 2709 | 1890 | 1179 | 309 | 247 | 13 | 11 | 9.0 | 7.0 | 5.2 | 3.7 | 2.5 |
| 2013 | 1831 | 1197 | 692 | 209 | 168 | 5.2 | 2.5 | 2.2 | 1.9 | 1.7 | 1.4 | 1.3 |
| 2014 | 5611 | 3279 | 1593 | 487 | 350 | 1.4 | 0.7 | 0.6 | 0.6 | 0.5 | 0.5 | 0.4 |
| 2015 | 18210 | 9997 | 4204 | 266 | 191 | 0.7 | 0.3 | 0.3 | 0.2 | 0.2 | 0.1 | 0.1 |
| 2016 | 10954 | 5925 | 2378 | 86 | 59 | 0.1 | 0.1 | 0.1 | 0.1 | 0.1 | 0.1 | 0.1 |
For more information refer to the full paper Great brome and barley grass – modelling the long term value of harvest weed seed control or contact Dr Catherine Borger, DPIRD on mobile +61 (0)467 816 082.
A new approach to managing loose smut on barley
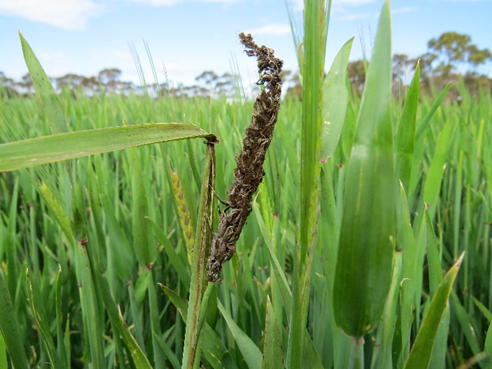
Loose smut of barley is caused by the fungus Ustilago nuda (Jens.) Rostra. The disease can cause significant yield reduction on susceptible barley varieties.e.g 25% head infection can reduce the yield by 1.6 tonne/ha.
Plants infected with loose smut produce ‘smutted’ heads consisting of several million spores encased in a fragile membrane. At this stage loose smut symptoms are obvious to the eye. The spores are released from the fragile membrane and are dispersed by wind, landing on the crop and infecting flowering heads. The spores germinate in the florets; the mycelia spreads to the embryo and surrounding tissue and survives dormant until the seed is sown.
Research scientist Dr Kithsiri Jayasena (DPIRD) conducted a two year trial at Kojaneerup South to investigate if foliar fungicides containing the active ingredient tebuconazole eg Orius® 430SC reduced loose smut infection of grain from an infected paddock. Alongside the field trial, a passive wind vane spore trap was placed to monitor for smut spores on a weekly basis.
In 2017, smut spores started to appear in the lower great southern (LGS) in late August and at the trial site around mid-September. Whereas in 2018, initial detection in the region was in early September and at the trial site in mid-September. These observations were used as a guideline to initiate foliar fungicide spraying along with plant growth stages (ear emergence to flowering).
| Treatments* | % Loose Smut** | % Reduction over Nil |
| Untreated | 4.3a | - |
| Spray at Z77 | 3.4a | 20 |
| Spray at Z59 | 0.7b | 84 |
| Spray Z59 + Z77 | 0.2b | 96 |
| p | 0.005 | |
| lsd (5%) | 2.0 |
* Orius® 430SC @ 290 mL/ha at Z59 (13 Oct) and/or Z77 (24 Oct), Hindmarsh was sown on 15 June.
**Values with same letter in each column not significant at p = 0.05 level.
In 2017, a single spray at growth stage Z59, or two foliar sprays incorporating a spray at Z59, significantly reduced embryo infection compared to untreated plants (Table 3). But a single foliar fungicide application at late milky stage Z77 did not show any significant treatment difference to the untreated plants (Table 3). This suggests that fungicide applications after flowering stage were too late to prevent embryo infection. Also this late application may not be feasible due to residue issues as the harvest with-holding period of tebuconazole is five weeks.
Applications of systemic foliar fungicide containing the active ingredient tebuconazole at ear emergence to late flowering can reduce loose smut infection in the seed that forms. While spore trapping in the region provided information on when the loose smut spores are in the air, foliar fungicide spraying should be based on when the crop is at the most vulnerable stage such as ear emergence to flowering. Since foliar fungicide can reduce loose smut levels in the following barley crop this application method could be integrated into the loose smut management plans for barley. When using fungicide at late foliar stages, the minimum withholding period of the product should be considered to avoid residue violations in delivered grain or applied only to the portion of crop to be retained for seed.
DPIRD recommends that growers restrict the use of this practice to seed crops only and to be mindful of fungicide resistance issues.
For more information refer to the full paper A new approach to managing loose smut on barley or contact Dr Kithsiri Jayasena, DPIRD on (08) 98928477.
"Give me a break!" – Options for paddocks infested with both root lesion nematodes and Rhizoctonia solani AG8
Rhizoctonia solani AG8 (rhizoctonia bare patch) is a fungal pathogen that causes root rot in a number of WA crops and can cause significant yield losses (up to 50% yield loss in wheat). Root lesion nematodes (RLN) can also cause significant yield loss to crop plants, with up to 40% in wheat for example. In WA, rhizoctonia bare patch and RLN often occur together in the same paddock, making management more complicated.
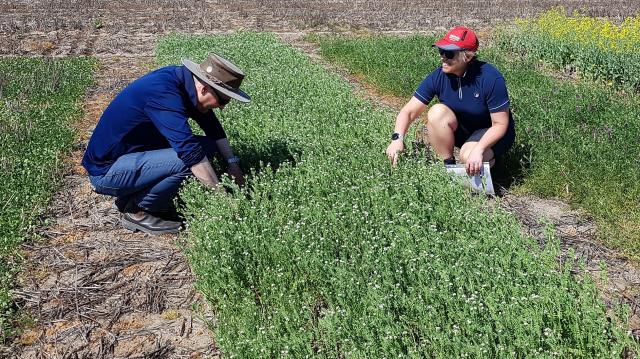
In 2018/19 three break crop trials, coordinated by Sarah Collins from DPIRD, were established in paddocks on grower properties at Calingiri, Grass Valley and Dumbleyung, where RLN and R. solani were both present at yield impacting levels. The trials investigate the most effective and profitable break crops in rotation with cereals for growers using break crop options agronomically suitable for these regions (Table 4).
| Year | 2018 | 2019 |
| |||
| Crop | Dumbleyung | Grass Valley | Calingiri |
| ||
| canola | ATR Bonito | ATR Stingray | ATR Stingray |
| ||
| faba bean | PBA Samira | - | - |
| ||
| lupin | PBA Jurien | Mandellup | Mandellup |
| ||
| serradella | Cadiz | Eliza | Eliza |
| ||
| chickpea | - | PBA Striker | PBA Striker |
| ||
| sub-clover | - | Dalkeith | Dalkeith |
| ||
| wheat | - | Calingiri, Mace | Calingiri |
| ||
| barley | - | La Trobe | La Trobe |
| ||
| field pea | - | PBA Butler | - |
| ||
| vetch | - | - | RM4 |
| ||
| oats | - | - | Williams |
| ||
| weed free fallow | - | yes | yes |
| ||
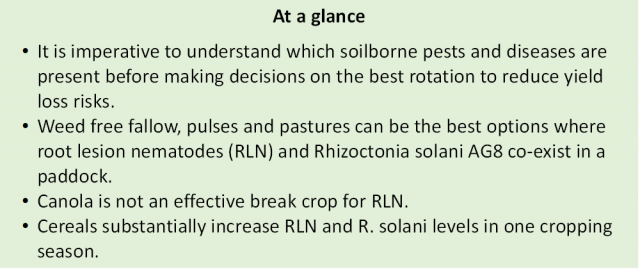
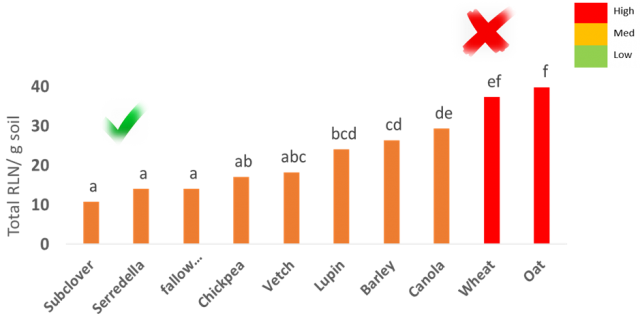
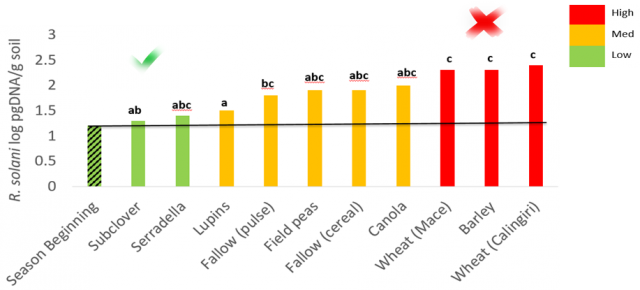
Pratylenchus quasitereoides is the most prevalent RLN at both Grass Valley and Calingiri sites. In general subclover and lupin rotations were the most consistent break options where R. solani and RLN were present in the same paddock (Grass Valley and Calingiri trials). Serradella consistently performed as a suitable break to reduce P. quasitereoides but was more variable in reducing P. neglectus and R. solani levels. Fallow, pulses and pasture rotations had the highest yields in the subsequent wheat crops. Canola is not a suitable break where RLN and R. solani occur together.
In Grass valley 2019, wheat was over sown on 2018 rotation crop plots, the highest yields of wheat were found in the plots that were sown to serradella or kept fallow in 2018. Barley is a crop susceptible to the impacts of P. quasitereoides; wheat yields from 2018 barley plots were 79% and 98% lower . Wheat grain yields in 2019 were significantly higher in all of the legume treatments than the cereal treatments and yield on the canola treatment was higher than on the 2018 barley and wheat (Calingiri variety) treatments.
Visual symptoms of RLN and rhizoctonia in plots were obvious in cereals at all three sites during the 2019 season. Symptoms included chlorotic plants, stunting and patching. At the beginning of the growing season in 2019, the root lesion nematode numbers were lowest in the plots sown to lupin and field pea or that had been left fallow in 2018 at Grass Valley (Table 5). At harvest 2019, the lowest amount of P. quasitereoides was in the plots sown to serradella, subclover and lupin in 2018 and the highest amount was in the 2018 canola plots. This indicates that the effectiveness of the these break to reduce RLN was successful through the following season.
There was no significant difference in the levels of R. solani between any of the 2018 break crop treatments, at the start of the wheat crop rotation at Grass Valley in 2019. However, at harvest, levels of R. solani were significantly lower in the 2018 lupin plots compared with the 2018 chickpea, canola, fallow and cereal plots. Serradella plots had variable levels R. solani at the end of season (Table 5).
| Crop Type | Crop 2018 | P. quasitereoides | P. neglectus | R. solani |
| 2018 | ||||
| Pasture | Serradella | 3.7(a) | 3.6(a) | 2.0(abcd) |
| Subclover | 3.8(a) | 4.8(a) | 1.7(ab) | |
| Pulse | Field pea | 6.1(abc) | 1.8(a) | 1.7(abc) |
| Lupin | 4.7(a) | 2.4(a) | 1.6(a) | |
| Chickpea | 6.2(ab) | 4.5(a) | 2.4(d) | |
| Fallow | Fallow | 5.4(ab) | 3.7(a) | 2.1(cd) |
| Oilseed | Canola | 17.1(d) | 4.2(a) | 2.3(d) |
| Cereal | Barley | 9.3(bcd) | 3.0(a) | 2.1(bcd) |
| Wheat (Calingiri) | 9.5(cd) | 2.9(a) | 2.2(cd) | |
| Wheat (Mace) | 8.4(bc) | 2.9(a) | 2.3(d) |
^ Letters represent a significant (p<0.10) difference using Fisher’s Protected LSD.
Regression analyses demonstrated that low levels of P. quasitereoides (p=0.02) or high nitrate levels (p=0.001) at the start of the season correlated to higher yields. However, the levels of P. neglectus and R. solani at the beginning of the season did not correlate with grain yields.
To complete this trial series 2019 break crop plots grown at the Calingiri site will be sown with a cereal crop. RLN and Rhizoctonia solani levels and impacts on cereal crop growth and yield will be measured and compared to the Grass Valley and Dumbleyung results.
For more information refer to the full paper Give me a break!” – Options for paddocks infested with both root lesion nematodes and Rhizoctonia solani AG8 or contact Sarah Collins on t +61 (0)8 9368 3612 or m +61 404488113.
Spraying for Red legged earth mites may become a thing of the past
From 2017 to 2019, the Department of Primary Industries and Regional Development has conducted resistance testing in WA as part of a Grains Research and Development Corporation (GRDC) investment being led by the University of Melbourne, in collaboration with cesar and CSIRO.
In WA, DPIRD entomologist Svetlana Micic, coordinated the collection of redlegged earth mites (RLEM) from 73 sites ranging from Gingin to Esperance, and as far west as Cowaramup. These sites ranged from the high to medium rainfall areas of WA.
The mites were then exposed to insecticides, and their survivorship was compared to that of a known susceptible population.
Of the 42 sites which had survivors, less than half (43%) had RLEM surviving exposure to a single insecticide.
Half of these sites (42 sites) had mites surviving exposure to either omethoate at 0.0058 g.ai/L and/or malathion at 0.5 g.a.i/L and/or bifenthrin at 0.1 g.a.i/L.
- Only about 30% (14 sites) had RLEM surviving exposure to bifenthrin only. Previous trials have shown that mites surviving rates of bifenthrin are resistant to all synthetic pyrethroid (SP) insecticides (Group 2A) but organophosphates (OPs) are still efficacious against them.
- About 10% of sites had RLEM that survived omethoate (3 sites) or malathion (1 site) indicating that SP’s are still effective in controlling mites at these sites.
About 60% of sites which had RLEM survive in bioassays had RLEM survive exposure to more than one insecticide:
- Of these 24% (10 sites) had RLEM that survived exposure to omethoate and malathion indicating that RLEM are becoming more tolerant of more than one insecticide in the Group 2B range. Even so, at these sites S’s will still have efficacy.
- Only in 5% (2 sites) was there cross resistance to SPs and omethoate. At these sites, malathion still had efficacy.
- Of concern is that about 30% (12 sites) had RLEM that survived all three insecticides. At these sites SP’s have little efficacy in controlling RLEM. Also the OPs malathion and omethoate as well as other insecticides in the OP group are unlikely to provide on-going control for RLEM.
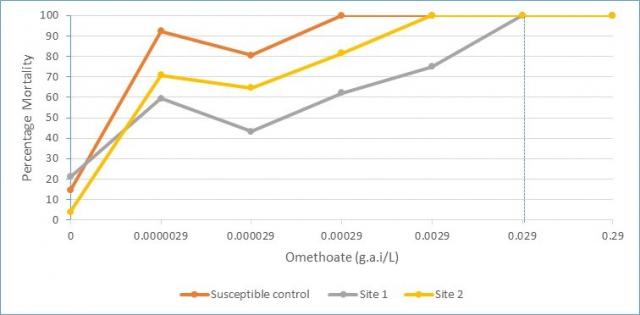
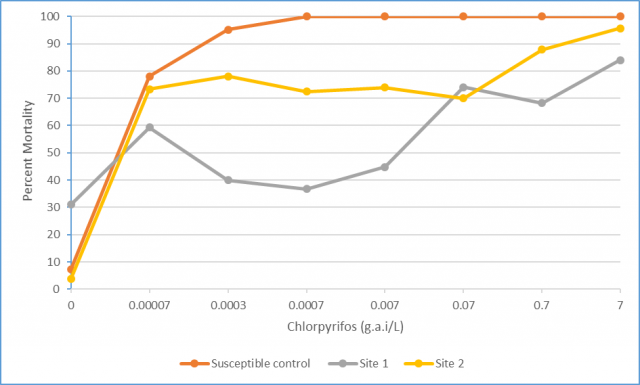
The results for only two sites (Site 1 and Site 2) are presented in more detail here. At these sites, growers reported RLEM surviving after applications of registered rates of OP’s and SP’s. It took 100 times more omethoate at site 1 and 10 times more omethoate at site 2 to kill RLEM when compared to the control (Figure 4). However for chlorpyrifos, even at 10 000 times the rate that killed RLEM in the susceptible population, there were still survivors at both sites (Figure 5).
For more information refer to Spraying for RLEM could become a thing of the past or contact Ms Svetlana Micic, DPIRD on +61 (0)427 772 051.
Determining effect of lime on small pointed (conical) snail fecundity and shell strength
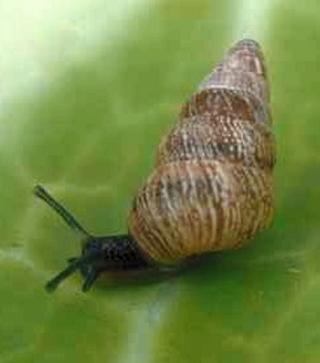
Snails obtain the calcium required for shells from their environment either from the soil or rock itself containing calcite (CaCO) or from Ca- and CO3- ions which are obtained from living or dead plant material. Surveys conducted by DPIRD found that in WA round snails tend to be found in areas where there is alkaline soils whereas small pointed snails can be found over any soil type.
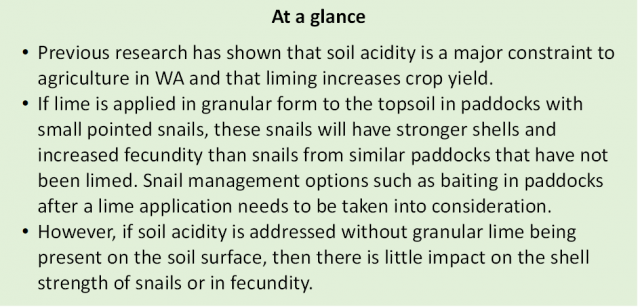
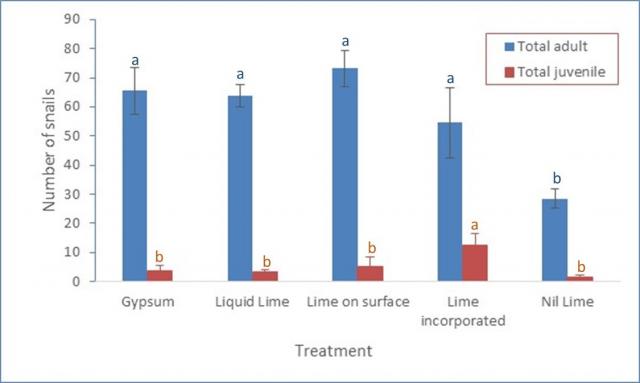
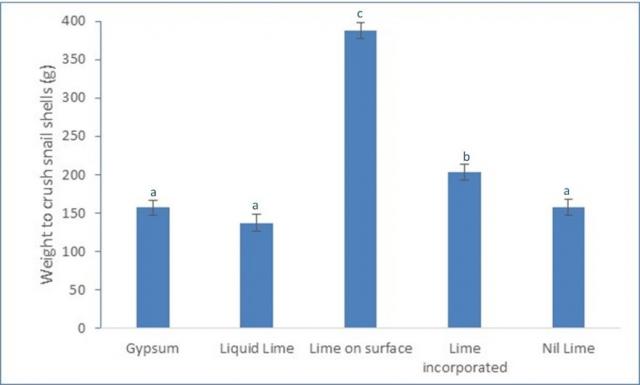
Research by entomologist Svetlana Micic, DPIRD Albany, shows that snails that had access to granular lime, either incorporated into the soil or on the soil surface produced more juveniles (Figure 6) and had stronger shells (Figure 7). It should be noted reatments with incorporated lime, still had lime present on the soil surface.
For more information refer to the full paper Determining-the-effect-of-lime-on-small-pointed-conical-snail-fecundity-and-shell-strength or contact Ms Svetlana Micic, DPIRD on +61 (0)427 772 051.
Controlling small pointed snails before they lay eggs
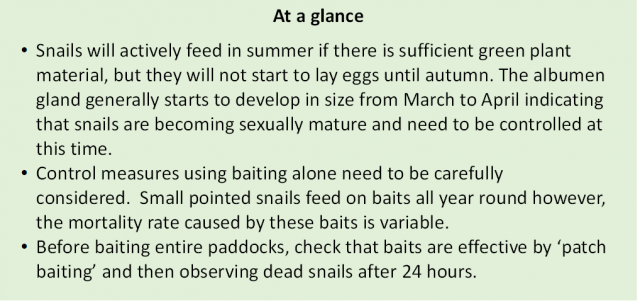
Before snails lay eggs, the albumen gland starts to increase in size. The role of the albumen gland is to secrete a nutritive secretion onto the fertilised egg. Until this gland is developed, snails are not sexually mature and will not lay eggs. If the timing of albumen gland development is known, then control measures such as baiting can be implemented before egg laying occurs. If control measures are put in place before eggs are laid then there will be a reduction in the overall snail population.
DPIRD entomologist Svetlana Micic conducted a 3 year research project to determine when small pointed snails will start to lay eggs based on the size of the albumen gland. Snail populations were collected from Woogenellup, Condingup and Munglinup.
Gland size in snails generally increased the most in March or April regardless of whether there was a summer rainfall event (Figures 8). The albumen gland reached peak size from May at most sites, indicating that at this time most snails were laying eggs.
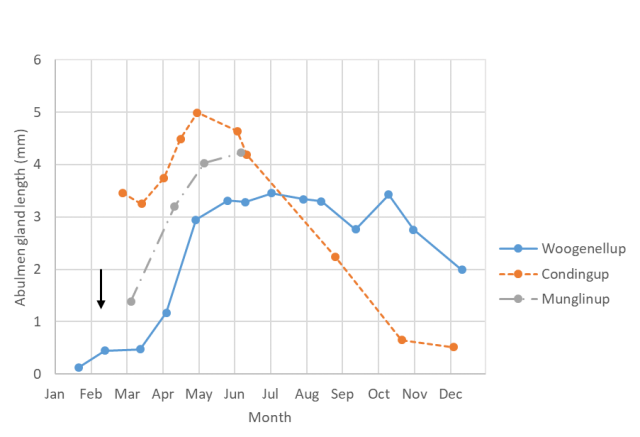
Therefore, snail control needs to occur before May (ideally from March to April) to ensure eggs have not been laid. Generally, by October the albumen gland had decreased in size indicating that the gland was no longer functioning and that snails were not laying eggs.
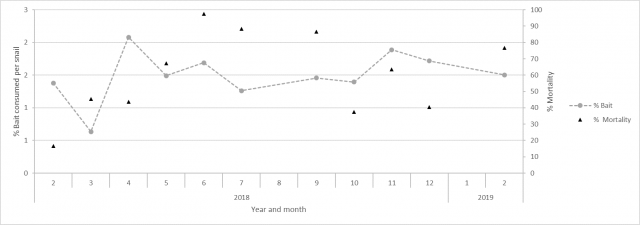
In 2018, Svetlana also investigated if small pointed snails consume metaldehyde baits differently throughout the year and what impact this had on mortality rates. In this trial, it was found that snails fed on the baits throughout the year.
While the amount of metaldehyde bait consumed by snails did not significantly differ from month to month (except for a lower amount consumed in March 2018), the mortality caused by the baiting differed from 20-90% between months. For instance, mortalities in February 2019 were more than four times those recorded for February 2018 (Figure 9). More research is required to determine the cause of the deaths, as it cannot simply be the time of the year.
For more information refer to Identification-and-control-pest-slugs-and-snails-broadacre-crops-western-australia or contact Ms Svetlana Micic, DPIRD on +61 (0)427 772 051.

