Why we are reporting this information
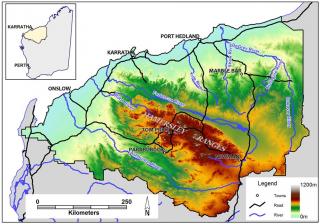
This information is from the Pilbara Hinterland Agricultural Initiative (PHADI) report series and provides a general description of the climate in the Pilbara region in Western Australia and the main climate drivers. Figure 1 shows the PHADI study area.

The Pilbara climate is challenging
The Pilbara has very hot summers, mild winters and low and variable rainfall. It is classified as hot desert in northern and inland areas and hot grasslands in the north-west. The Pilbara claims a number of climate records:
- seven of Western Australia’s top 10 hottest days (to 2016), with Mardie recording the hottest day on record – 50.5 degrees Celsius (°C)
- most sunshine hours a day in Australia (more than 10 hours a day)
- second highest inter-annual variability in rainfall (second only to central Australia)
- the most cyclone-prone area along the Australian coastline.
Temperature in the Pilbara
During summer and early autumn (December to March), average daily temperatures exceed 30°C across the region, with average daily maxima exceeding 35°C from October to March. In northern inland areas, such as Marble Bar, average maxima exceed 40°C during summer and temperatures exceeding 45°C are common.
During the winter months (June to August), average temperatures are around 20°C across the region. Coastal areas have a smaller annual temperature range compared to inland areas, and winter temperatures rarely drop below 10°C. Except for the upland areas of the Hamersley Ranges and south-eastern inland areas, there is minimal risk of frost.
Rainfall in the Pilbara
Rainfall is spatially and temporally variable:
- Annual rainfall declines from 300–350 millimetres (mm) in the north-east to less than 250mm in the south and west.
- Elevated areas in the Hamersley Ranges average more than 500mm.
- Rainfall is greatest during summer and autumn and least during winter and spring.
- Rainfall in the eastern Pilbara is most influenced by tropical and monsoonal drivers, which are predominantly active in summer and autumn.
- Rainfall in the western Pilbara is also influenced by southern mid-latitude drivers, such as frontal systems, during autumn and winter.
Tropical cyclones cause the most extreme rainfall events and generate 25–34% of the total annual rainfall near the Pilbara coast and as much as 21% up to 450km inland. Tropical cyclones contribute from 0 to 86% of summer rainfall in the north-west.
Historically, tropical cyclones have caused considerable damage and loss of life in the Pilbara, and as a result modern design regulations ensure that buildings and other infrastructure are now far less susceptible to damaging winds. Even the threat of a tropical cyclone can cause substantial economic losses to the mining and offshore oil and gas industries through halted production or disruptions to shipping activities.
Evaporation in the Pilbara
Hot, dry and sunny conditions in the Pilbara lead to very high evaporative demand.
- Point potential evaporation (PPE) can exceed 3000mm per year over much of the Pilbara (PPE represents the evapotranspiration that would occur from small, well-irrigated fields surrounded by non-irrigated land).
- The higher areas of the Hamersley Ranges are cooler and subject to greater summer cloud cover and so have the lowest evaporative demand: averaging 10–14mm per day (mm/d) in the summer months and 4–7mm/d in the winter months.
Climate change in the Pilbara
Over the last 40–60 years, average annual temperatures have increased across most of Western Australia.
In the Pilbara:
- temperatures increased most during winter and spring and cooled during autumn and summer
- warming during the largely cloudless winter and spring is in line with global trends, and summer cooling is likely caused by increasing summer rainfall and associated cloud cover over north-western Australia
- annual rainfall increased over most of the Pilbara, except in the west where it decreased (YouTube WA annual rainfall animation).
- rainfall intensity and number of rain days have also increased in the central and eastern parts and decreased in the west
- The decline in autumn and winter rainfall over the western Pilbara has coincided with major shifts in the large-scale atmospheric circulation of the southern hemisphere. These changes include a southward shift in the subtropical ridge and the southern hemisphere westerly jet stream. (YouTube WA November–April and May–October rainfall animations)
Climate projections for the Pilbara
Climate projections show very high confidence for substantial temperature increases to continue in the Pilbara, with the north-west of Western Australia warming more than elsewhere in Australia.
Annual average temperature is projected to increase:
- by 2030 a rise of 0.6–1.5°C for all emission scenarios
- by 2090 a rise of 1.5–3.1°C for medium (RCP4.5) and 3.1–5.6°C for high (RCP8.5) emission trajectories.
Annual rainfall is projected to remain largely unchanged to 2090 and there is high confidence that natural rainfall variability will remain the primary driver of rainfall changes to 2030. There is medium confidence that tropical cyclones will become less frequent in future, but will increase in intensity.
There is high confidence that potential evaporation will increase, but only medium confidence in the magnitude of the change.

