Why are climate trends important?
Managers can use climate trend data, together with data on likely causes and effects, to model projected conditions and plan for the changes. Climate change is affecting Australia's natural environment and the human systems it supports. Agriculture is strongly affected by weather patterns and climate.
As global temperatures increase, the hydrological cycle intensifies and atmospheric circulation patterns change, the tropical belt widens and winter storm tracks and subtropical dry zones move towards the poles. These changes are greater and more persistent than expected from purely natural inter-annual and inter-decadal (for example, the El Nino southern oscillation) climate variability. Changes in patterns, spatial occurrence and frequency on these climate factors are consistent with global warming.
Visit the Climate Lab Book's climate spirals page to see a graphical representation of global temperature change each month from 1850 to 2017.
You can also see a graphical representation of the real-time global temperature, wind, ocean currents and other surface characteristics (click on 'earth' to discover the various datasets) on earth - a visualization of global weather conditions forecast by supercomputers.
Temperature changes
South-west temperatures have increased
Between 1910 and 2013, average annual temperature increased by 1.1 degrees Celsius (°C), with similar increases in average daily maxima and minima. Seasonal average temperatures are generally warmer, except for some areas of the south coast where temperatures have declined during summer. These changes reflect stronger high pressure systems over southern WA, with onshore winds moderating temperatures on the south coast.
Hot spells are generally increasing
Hot spells are defined by the Bureau of Meteorology as three or more consecutive days with maximum and minimum temperatures that are unusually high for that location.
However, this definition is not universally accepted and studies of hot spell characteristics differ in their outcomes depending on how they are defined. There are some common themes for trends in hot spells since the 1950s:
- the intensity (the temperature) of hot spells generally increased, except along parts of the south coast
- the frequency of hot spells generally increased
- the duration of hot spells generally increased, except in south coast areas.
In Perth, between 1981 and 2011:
- the annual average intensity of hot spells increased by 1.5°C
- the annual number of events increased by 1
- the annual average number of hot spell days increased by 3
- the first hot spell occurred 3 days earlier, compared to conditions between 1950 and 1980.
South-west frost risk has decreased on the coast and increased inland
Historically, the central and eastern parts of the grainbelt have the greatest frost incidence, while the northern and coastal areas have less risk. There has been noticeably more frost from the 1990s to the 2000s, a period of drier weather conditions. Increased frost risk has been attributed to stable, cloudless conditions associated with increased high pressure systems, resulting from changes in the position and the intensity of the subtropical ridge. Changes in frost risk have been variable, depending on proximity to the coast and the mitigating effects of maritime airflows.
In inland areas
- the frost period has increased in length by 2–4 weeks
- the start and end dates have shifted to later in the year (between September and November).
In southern coastal areas
- the frost window declined by 2–5 weeks.
Kimberley temperatures have increased in winter and decreased in summer
Between 1910 and 2013, average annual temperature increased by 0.9°C. Average summer temperature declined because increasing summer rainfall and associated cloud cover gave a cooling effect.
The intensity of hot spells generally decreased over the north-west. Trends in the frequency and duration of hot spells are not clear and differ according to how they were estimated.
Pilbara and interior temperatures have increased
Between 1910 and 2013, average annual temperature increased by 1.0°C in the interior of the state.
The intensity of hot spells increased over inland WA by 1°C to about 41°C, during the period 1958–2010. The frequency and duration of hot spells generally increased.
Rainfall changes
In the south-west, rainfall has decreased
The decline in rainfall over the south-west is consistent with increasing greenhouse gas concentrations and cannot be explained solely by natural climate variability or changed land use, such as land clearing.
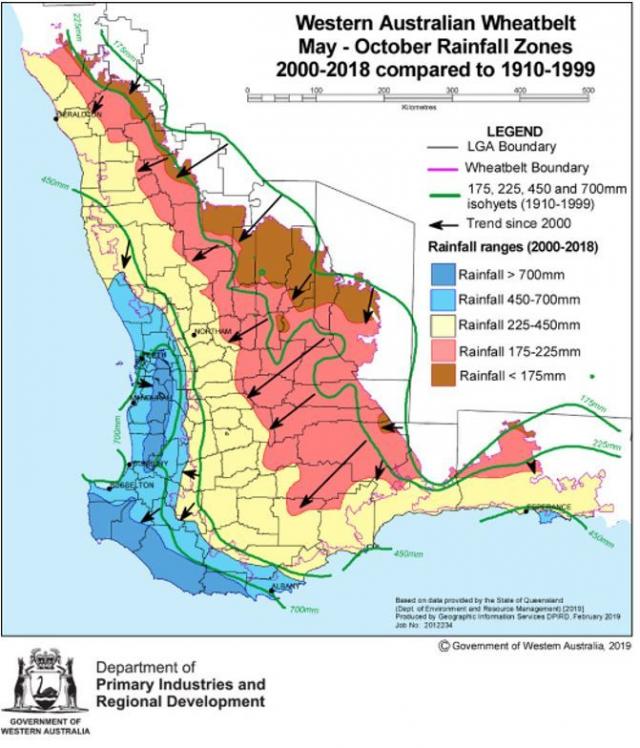
There have been dramatic movement of isohyets to the west after about 1990. The arrows in Figure 1 shows how far the May to October isohyets have moved since 2000. Significant areas of the north-east grainbelt are now at high risk of rainfall too low for profitable agriculture (brown area in Figure 1).
Annual rainfall has declined over the last 60 years along the west coast, and particularly in the far south-west, where a decline of up to 20% occurred.
Declining rainfall in the grainbelt has effectively resulted in a westward shift in rainfall zones by up to 100 kilometres in some areas, with relatively little change along the south-east coast (YouTube SW annual rainfall animation).
The decline in autumn and winter rainfall in the south-west is attributed to the southward shift of the subtropical ridge and the southern hemisphere polar jet stream (YouTube SW May–October rainfall animation). The associated strengthening of the polar jet stream and a 17% reduction in the strength of the subtropical jet stream over Australia has reduced the likelihood of storm development over the south-west. This is most likely the result of a weakening of the temperature gradient between the equator and the poles.
A weaker subtropical jet stream leads to slower alternation of low and high pressure systems, and weaker surface low pressure systems and cold fronts. The stronger polar jet stream is associated with low pressure anomalies over Antarctica and high pressure anomalies over the mid-latitudes. Consequent rainfall reductions over south-west WA are associated with the persistence of high pressure systems over the region. While heavy rainfall events can still occur, they are often interspersed by longer dry periods.
In the Kimberley and Pilbara, rainfall has increased in most areas
Over the last 60 years, annual rainfall has increased over northern and interior WA (YouTube WA annual rainfall animation). A recent study of tree growth in the Pilbara found that 5 of the 10 wettest years in the last 210 years occurred in the last two decades.
High sea surface temperatures off the north-west coast and increased summer rainfall in the Kimberley and Pilbara have coincided with major shifts in the large-scale atmospheric circulation of the southern hemisphere (YouTube WA November–April rainfall animation). These changes include a southward shift in the subtropical ridge and the polar jet stream. In addition to increased annual rainfall, the seasonality (that is, the difference between rainfall amount in the driest and wettest periods) has also increased in northern WA.
The decline in autumn and winter rainfall over the western Pilbara is attributed to the same climate drivers as in the south-west (YouTube May–October rainfall animation).
Agricultural water supplies have decreased in the south-west
In 2011–12, agricultural water use accounted for 24% of the total 1420 gigalitres of water used in WA. Groundwater, large dams and on-farm dams or tanks were the primary sources of water used on farms. Irrigation was the largest component of total agricultural water use at 73%, with pasture and fodder production being the largest users of irrigation water.
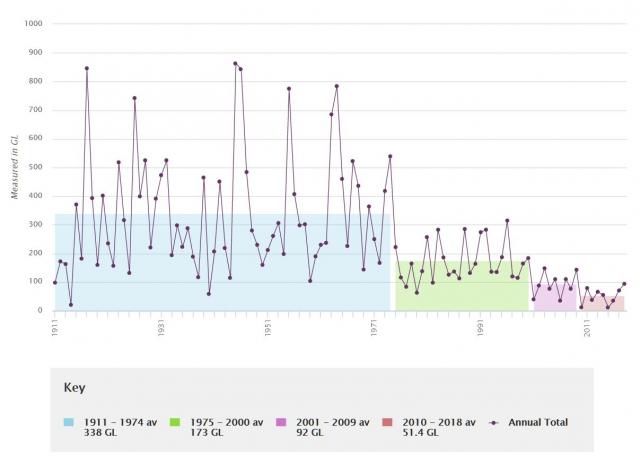
The Water Corporation monitors surface water and groundwater resources across WA. Water level trends are an indicator of how the resources are responding to current climate and abstraction. Where surface water has been monitored, there has been a trend over the last 10 years for streamflow to increase in the Kimberley and decrease in the south-west (Figure 2). Where aquifers have been measured, levels are generally stable or seasonal in the Kimberley, Pilbara and Gascoyne regions; increasing, stable or seasonal in the Mid West; and stable or decreasing in the south-west of the state.

Tropical cyclone fequency has been stable but intensity may have increased
Tropical cyclones are responsible for most of the extreme rainfall events across north-west WA and generate up to 30% of the total annual rainfall near the Pilbara coast. Tropical cyclones make a valuable contribution to rainfall in the north-west, and inter-annual and spatial variability strongly affects the reliability of this rainfall as a source for water supplies. Over the last 40 years, the frequency of tropical cyclones has not changed significantly in WA, but there is some evidence that the frequency of the most intense cyclones has increased.
Fire risk has increased
Fire danger has increased across Australia over the last 40 years in response to drier and hotter conditions. The relative importance of weather and fuel varies in determining the risk of fire. Fires are not limited by the amount of fuel or the weather during the dry season in northern savannas. In south-west forest areas, fire risk is strongly determined by weather conditions and fuel moisture content.
Between 1973 and 2010, annualised fire weather danger (defined by the Bureau of Meteorology) showed a non-significant, increasing trend at Port Hedland, Carnarvon, Meekatharra, Geraldton, Albany and Esperance, and a statistically significant increase (P<0.05) at Perth, Kalgoorlie and Broome. On a seasonal basis, fire weather danger increased more in winter and spring, compared to summer and autumn. The frequency of extreme fires also increased, with significant increases at Perth, Kalgoorlie and Broome.


