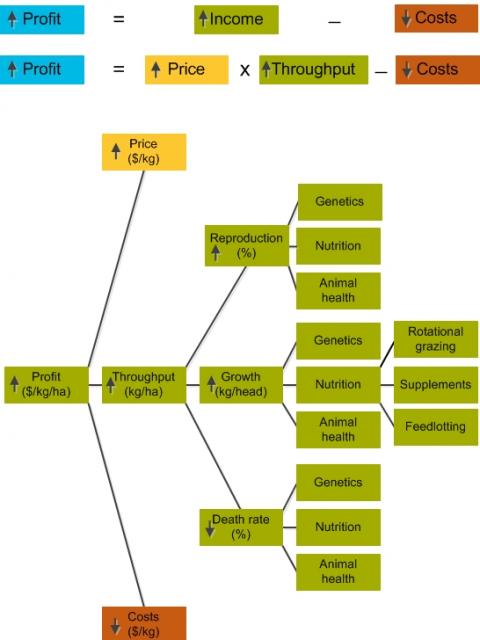
Figure 1 is part of a profit driver tree for a beef business. It shows the key factors that impact on profit through increasing throughput, and a few of the practices and technologies that could be implemented. Many more practices and technologies are available to impact on throughput, but these are not shown in the diagram. The full profit driver tree would include key factors, practices and technologies associated with increasing price and decreasing costs.

This driver tree combines equations with a tree diagram, to show the key factors that impact on profit. The equations at the top show how income and costs determine profit. Income depends on two factors – price and throughput. To increase profit, price and/or throughput need to increase, and/or costs need to decrease.
Below the equations is a tree diagram that identifies the key factors that influence throughput. The key factors that influence price and costs have not been included in the diagram but would be included in a full profit driver tree. In Figure 1 you can see how the driver tree expands further to give more detail about how to increase throughput.
The driver tree shows that the key factors that impact on increasing throughput are increasing growth rate, increasing reproduction rate and decreasing death rate. Each of these three factors in turn is influenced by genetics, nutrition and health. A number of management practices and technologies could potentially improve nutrition in the short to medium term.
The level of influence that each of the key factors, practices and technologies will have on profit will vary depending on the business. For example, in one beef business the margin from increasing growth rate may be significantly greater than the margin from increasing reproduction rate in the short to medium term. Therefore, you would focus on increasing growth rate.
Taking this example further, the potential margin from using improved nutrition to increase growth rate, may be significantly higher than the margins from improving genetics or animal health.
The driver tree shows several, but not all, of the management practices and technologies that could improve nutrition. In this example, implementing a rotational grazing program may produce a higher margin than feeding supplements or feedlotting.
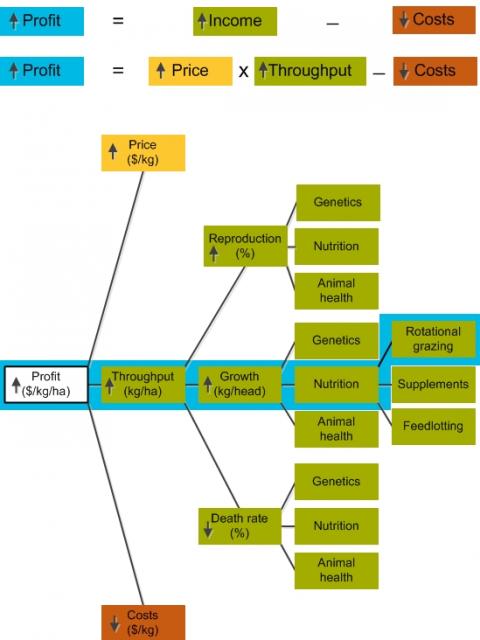
Figure 2 shows how the profit driver tree helps to identify a higher impact strategy. In this case, the strategy is to implement a rotational grazing program to improve profit. The logic for this decision is that a rotational grazing program will improve nutrition, which will improve growth rate, which will in turn improve throughput.

Using a driver tree is as much about identifying what not to focus on, as it is to identify what to focus on. While lots of management practices and technologies could have impact, there are much fewer that will have significant impact. Driver trees are also a quick way to summarise the practices and technologies that are already in place.
How to develop a driver tree
You will already have much of the information needed for a driver tree. Additional information may come from advisers, economists, technical experts, other businesses, and information products like industry best practice guides.
The steps for developing a driver tree are:
- Develop a SMARTT goal so that you know what the driver tree will focus on, for example increasing profit. The SMARTT goal tool can help with this.
- Think about the small number of key factors at the highest level, that impact on the success of the goal (see Figure 1). Work out which of these key factors would have most impact. gross margin analysis can help with this.
- For each of the key factors, think about what drives improvement in them and which of these would impact most on profit (see Figure 1).
- Keep expanding the tree until you can identify specific practices and technologies that could be put in place (See Figure 1). Work out which of these will have most impact on profit.
- Review the tree to decide on one or more high impact strategies for achieving the goal (see Figure 2). It is best if these decisions are based on objective information such as comparisons between gross margins.
- If you have several possible strategies identify the priority options.
- Once you have your priority options, work out what needs to be done to implement them.
Other tools to use with driver trees
Driver trees can be used in step 2 of the CI&I – Continuous improvement and innovation process.
The SMARTT goal tool can be used to provide focus for the driver tree.
Gross margin analysis can be used to work out the margins for different critical factors, management practices and technologies.
The Eight criteria technique can help to compare different improvement strategies.
Once you have chosen an improvement strategy, the Action design tool or Five Ws and one H can be used to develop an action plan.
Support to use the tool
Please contact us if you would like help to develop or use a driver tree.
