Southern WA sheep reproductive rates based on pregnancy scanning
Rebecca Butcher DPIRD Moora, WA; Andrew van Burgel DPIRD Albany, WA
Author correspondence: rebecca.butcher@dpird.wa.gov.au
Introduction
Pregnancy scanning is a useful tool available to sheep producers to improve productivity and profitability. Knowing whether ewes carry singles or multiples helps with strategic paddock and supplementary feed allocation and allows appropriate feeding to increase lamb survival rates, particularly for multiples. Scanning also allows for early management decisions of dry ewes, culling in years where feed availability is low or retaining to run as whether for shearing in years when feed availability is high.
Pregnancy rate is calculated as the number of ewes scanned as pregnant per 100 ewes joined. Reproductive rate in ewes is calculated as number of scanned foetuses per 100 ewes joined. Reproductive rate is an expression of the potential lambing rate and is used to determine supplementary feeding and stocking rates for lambing, determining lamb survival rate and mapping the progress of genetic selection for reproduction traits.
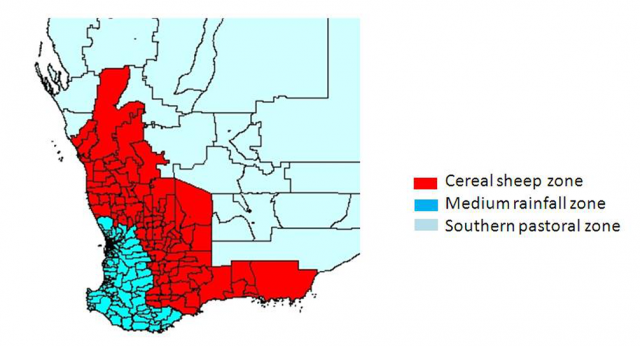
Pregnancy scanning data for Merino and meat breed sheep is collected on a yearly basis from scanning consultants across southern Western Australia. DPIRD has records from 2015 to the current season with approximately 100,000 records in each year. The data is geographically distributed across two zones: the cereal sheep zone (CSZ) and the medium rainfall zone (MRZ). The CSZ extends from the Geraldton area in the north west to the Esperance region in the south east and is often known as the wheatbelt. The MRZ includes the whole south west, from the Perth area in the north, to Albany in the south and is often known as the wool belt (Figure 1). Pregnancy scanning data included across these two zones stretches from the West Midlands to south of Perth, as far west as Darkan, south to Mt Barker and east to Jerramungup and Ravensthorpe, including an area surrounding Moora including Dandaragan, Wongan Hills, Victoria Plains and Gingin Shires.
In 2020 data was collected from a total of 431,129 scanned ewes. Artificially inseminated (AI) and maiden ewe results were removed, as were non-Merino ewes. This left a total of 382,198 ewes across 236 producers, with the CSZ having 54% of producers and 46% of ewes. Results from non-Merino ewes were considerably more variable with reproductive rates averaging 0.90 and 1.40 for flocks with <500 and >500 sheep respectively.
Pregnancy and reproductive rates in 2020
The average pregnancy rate for Merino flocks was 88% (12% dries; n = 236 producers).
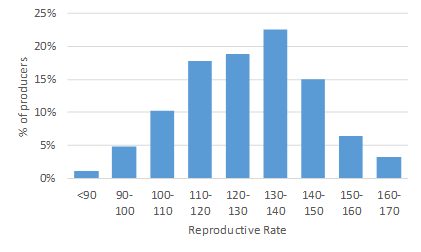
The average reproductive rate for Merino flocks was 128% (n = 93 producers), with most producers between 130-140%. Excluding one low outlier, the range of reproductive rates was from 97% to 166% (Figure 2).
The reproductive rates were not significantly different between the CSZ (130%) and MRZ (127%). The CSZ had significantly more twins (40 vs 36%) which was offset by a 2% lower pregnancy rate.
In a similar way, pregnancy rates were significantly higher for producers with larger flocks (>1000 ewes) at 89% compared to 85% for smaller flocks (<1000 ewes), however the larger flocks had less twins (37% vs 42%) so that the reproductive rates were not significantly different between groups.
Pregnancy rates were also significantly higher for producers that scanned for twins (90%) compared to producers that only scanned for pregnancy (87%).
Month of scanning
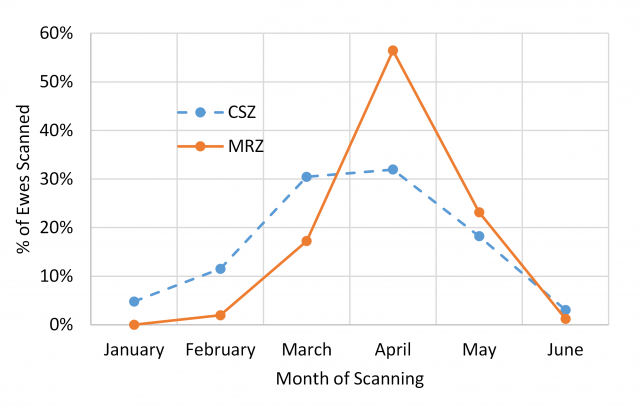
The time of scanning was earlier for the CSZ with nearly half (47%) of ewes scanned by March, while only 19% of ewes in the MRZ were scanned by March (Figure 3).
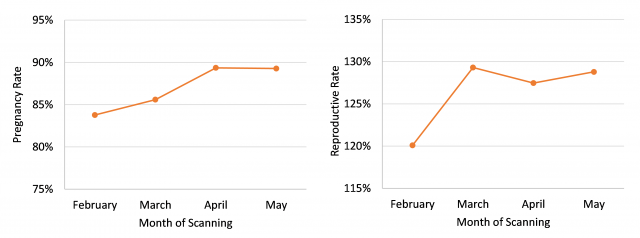
The pregnancy rate for scanning in February (84%) and March (86%) were significantly lower than the pregnancy rate for April (89%) (Figure 4). The reproductive rate was also lower for scanning in February, but not for March. The reproductive rate dataset is smaller and the differences in reproductive rate between months is not statistically significant.
Reproductive rate trends over time
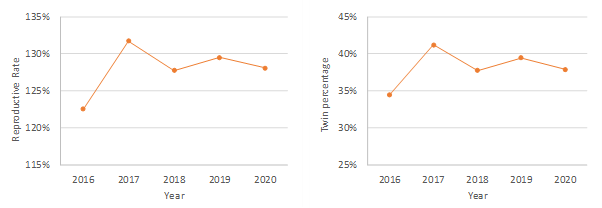
Reproductive rates were calculated from 2016 to 2020 (Figure 5). There was a significant increase from 2016 (123%) to 2017 (132%), followed by a significant decrease in 2018 (128%). The pattern in reproductive rate followed the pattern in percentage of twins.
Sheep pregnancy scanning benchmark tool
This tool is a simple calculator for sheep producers that allows them to benchmark sheep pregnancy (reproductive) scanning rates against flocks with similar genotypes and time of lambing in the region. It provides producers with an idea of their potential lambing, the region’s best practice and where their flock’s performance sits in relation to other flocks.
This tool is available on the DPIRD website agric.wa.gov.au/sheep/pregnancy-scanning-benchmarks.
Importance of scanning
Knowing pregnancy status and number of lambs conceived is important for allocating adequate feed and paddocks, especially to twin bearing ewes. Scanning can assist with management decisions such as whether or not to cull dry ewes or keep to run as wethers for wool production. The value of pregnancy scanning increases during poor seasons or times of likely feed shortage affecting pregnancy.
Seasonal conditions impact on joining and subsequent scanning data. Having ewe condition score at joining and/or scanning would add value to the pregnancy scanning dataset.
References
Brien, Forbes. 2020. Why scanning makes sense. mla.com.au/news-and-events/industry-news/why-scanning-makes-sense/

