DXA calibration at WAMMCO, Katanning
Steve Connaughton, Murdoch University Perth, WA
Author correspondence: s.connaughton@murdoch.edu.au
Introduction
Dual Energy X-ray Absorptiometry (DXA) is an imaging method shown to predict lamb carcass composition with a very high level of precision and accuracy. It uses two x-ray images produced at different photon energies, allowing for the differentiation of fat, lean muscle, and bone within the lamb carcass. There are five large abattoirs in Australia that have DXA installed and operating at chain speed, providing real-time carcass composition results. The most recent installation was at WAMMCO, Katanning, in southern Western Australia. This work focused on the calibration of the DXA and ability of the DXA to accurately predict lamb carcass composition.
Overview
In early August 2021, 201 lambs from the Meat and Livestock Australia (MLA) resource flock at the Department of Primary Industries and Regional Development’s (DPIRD) Katanning Research Facility were slaughtered at WAMMCO. These lambs are of a known and varied phenotypic and genotypic range. All lambs were placed through the DXA scanner, and 100 of these were selected to be CT scanned at Murdoch University, one to two days post-slaughter. CT scanning is the gold standard for determining carcass composition, allowing DXA predictions of composition to be directly compared to it and validated. The comparison between CT and DXA predictions of carcass composition was assessed, with a synthetic phantom block used to calibrate the WAMMCO DXA to the algorithm used at the original Bordertown DXA in South Australia.
Methods and materials
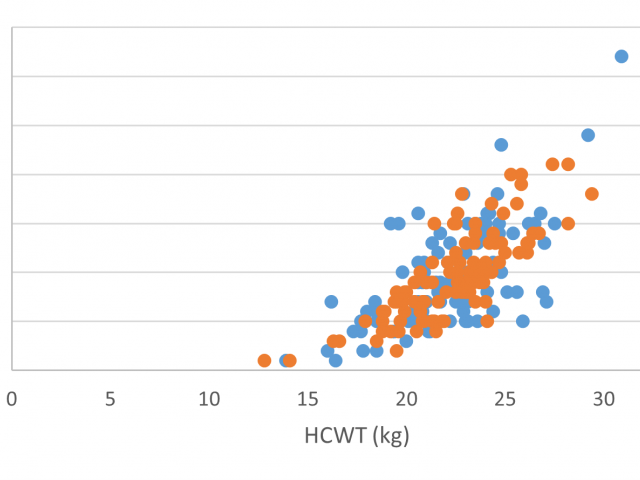
The WAMMCO facility processed 201 lambs, with a spread of Hot Carcass Weight (HCWT) from 12.8 to 30.9kg (mean 22.25kg) and GR tissue depth of 1mm to 32mm (mean 9.65mm). 100 of these lambs were selected to optimise the spread of phenotypes (Table 1) and genotypes and sent to be CT scanned at Murdoch University. The spread of HCWT and GR measurements for all lambs can be seen in Figure 1.
| HCWT (kg) | GR (mm) | |||||||
| Mean | SD | Min | Max | Mean | SD | Min | Max | |
| CT Group | 22.35 | 2.804 | 12.8 | 29.4 | 9.63 | 4.584 | 1 | 21 |
| Non-CT Group | 22.16 | 2.958 | 13.9 | 30.9 | 9.67 | 5.158 | 1 | 32 |

Fat score and GR predictions versus CT predictions
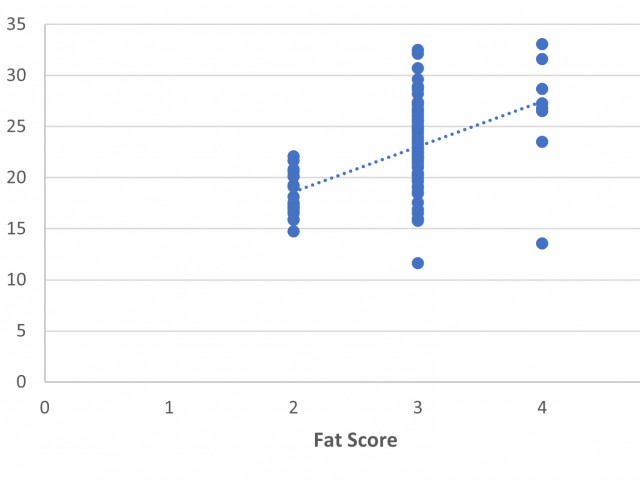
Fat score by palpation and GR tissue depth by GR knife were measured and compared to the CT fat percentage. Palpated fat score directly predicted CT fat percentage with poor precision, with R2=0.27 and RMSE=3.87% (Figure 2).
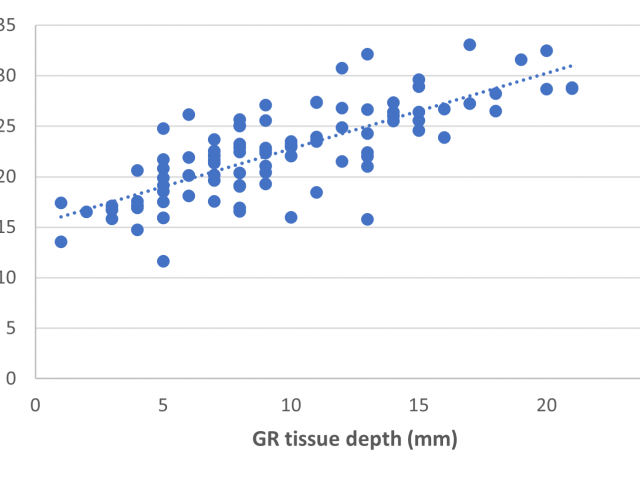
GR measurement using a GR knife directly predicted CT fat percentage better than palpated fat score, with R2=0.59 and RMSE=2.88% (Figure 3). The addition of HCWT with GR in predicting CT fat percentage was not significant.
Calibrated DXA predictions versus CT predictions
A mix of plastic ‘phantoms’ was scanned during this calibration experiment, which allowed us to correct the WAMMCO DXA in line with the original calibration site in Australia. This correction gave excellent results, as has been done at all previous DXA sites around Australia.
The calibrated DXA predictions of CT fat, lean and bone percentages are comparable to the CT determinations of compositions (Tables 2 and 3).
| CT Fat % | CT Lean % | CT Bone % | ||||||
| Mean ± SD | Min | Max | Mean ± SD | Min | Max | Mean ± SD | Min | Max |
| 22.55 ± 4.38 | 11.63 | 33.09 | 58.56 ± 3.23 | 51.61 | 68.71 | 18.89 ± 1.89 | 15.24 | 23.22 |
| DXA Fat % | DXA Lean % | DXA Bone % | ||||||
| Mean ± SD | Min | Max | Mean ± SD | Min | Max | Mean ± SD | Min | Max |
| 22.77 ± 4.06 | 11.77 | 30.82 | 58.94 ± 2.89 | 53.22 | 66.76 | 18.28 ± 1.17 | 15.96 | 21.46 |
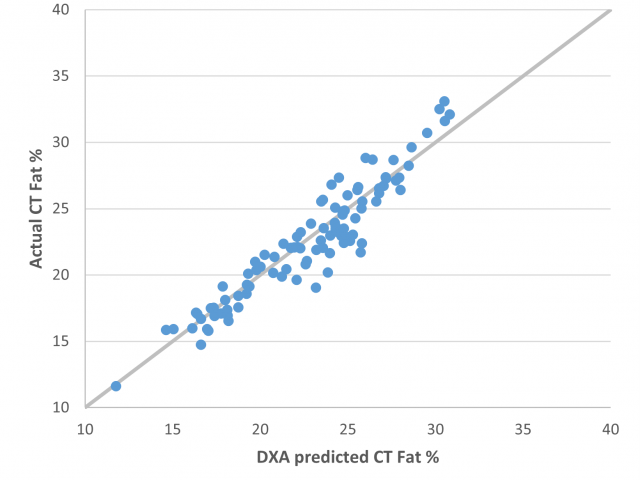
There is a small slope and bias evident in the fat, lean and bone percentage predictions, however the precision demonstrated here is very high (Table 4) with R2=0.89 and RMSE=1.46% for DXA fat percentage predictions and R2=0.78 and RMSE=1.52% for DXA lean percentage predictions. This is comparable to other DXA sites around Australia. The precision and accuracy of the fat percentage predictions can be visualised in Figure 4.
| DXA Fat % | DXA Lean % | DXA Bone % | |
| R2 | 0.89 | 0.78 | 0.46 |
| RMSE | 1.46% | 1.52% | 1.39% |
| Slope | 1.02 | 0.99 | 1.09 |
| Bias | 0.22 | 0.38 | -0.60 |
Conclusion
The DXA system at WAMMCO was successfully calibrated against the other systems in Australia. It is now producing numbers with a high level of precision and accuracy. Importantly, this experiment has highlighted the enormous improvement that DXA has made in predictions of carcass composition, particularly fatness, compared to the current Australian standard of GR measurement or palpated fat score.
The feedback producers will be able to receive about their lamb mob from DXA is far richer and more precise than the information currently available and will allow producers to make effective decisions about future genetic selection and farm management decisions. This may become important when DXA composition values become a trait that can be traded upon by the sheep meat industry in future.


