Recent climate
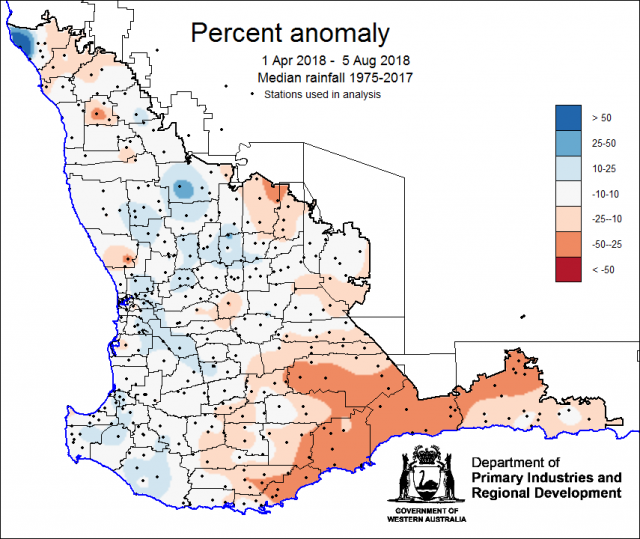
July rainfall was generally near average for the grainbelt, with some parts of the northern grainbelt receiving between 8-9 decile rainfall. May to July rainfall was generally below average, with large parts of the Great Southern and south coastal only receiving decile 1 rainfall (see the Bureau of Meteorology for details). Both the SSF and the Bureau’s POAMA model indicated below average rainfall was more likely for the grainbelt in the May Seasonal Climate Outlook. July maximum and minimum temperatures were above average. The percent anomaly map for 1 April to 5 August shows large parts of the grainbelt has received more rainfall than normal for this time, but the southern grainbelt and Esperance region is tracking below average.
In July the atmospheric pressure was lower than normal over southern Australia, bringing cold fronts to the northern and central grainbelt. The Indian Ocean sea surface temperatures north-west and west of Western Australia continue to be near normal from June.
The Southern Annular Mode (SAM), also known as the Antarctic Oscillation (AAO), describes the north–south movement of the westerly wind belt that circles Antarctica, dominating the middle to higher latitudes of the southern hemisphere. SAM is currently negative. In a negative SAM event, there is an equatorward expansion of the belt of strong westerly winds and this shift in the westerly winds results in more storm systems and lower pressure over southern Australia, which was the case in July. The Bureau’s POAMA model indicates SAM to remain negative until mid-August, when it will return to neutral.
The El Niño–Southern Oscillation (ENSO) remains neutral. More than half of international climate models predict warming of the Pacific Ocean to recommence in the coming weeks, with an El Niño likely to develop by October and persisting through the summer. The Bureau's ENSO Outlook remains at El Niño WATCH. El Niño WATCH means there is approximately a 50% chance of El Niño forming in 2018; double the normal chance. The Indian Ocean Dipole (IOD) remains neutral. Three of six international climate models indicate a positive IOD event may develop in August. A positive IOD event typically reduces winter–spring rainfall in central and southern Australia, and can exacerbate any El Niño driven rainfall deficiencies. See the Bureau of Meteorology’s IOD and Pacific Ocean interaction for details.
The table below gives a summary of past month and three month south-west Western Australia (SWWA) climate conditions, and can be used as an indication of what is likely to occur in the near future, if climate conditions follow the current pattern.
| Climate indicator | Past month | Past three months |
|---|---|---|
| SWWA rainfall | Generally average | Below average |
| SWWA mean temperature | Above average | Above average |
| SWWA atmospheric pressure | Lower | Higher |
| Indian Ocean Sea surface temperature | Near normal | Near normal |
| El Niño/Southern Oscillation (ENSO) | Neutral | Neutral |
| Indian Ocean Dipole (IOD) | Neutral | Neutral |
| Southern Annular Mode (SAM) | Negative | Near neutral |

