Summary
The Department of Primary Industries and Regional Development’s (DPIRD) Statistical Seasonal Forecast system is indicating a neutral (40-60%) chance of exceeding median rainfall for February to April 2018 for the majority of the grainbelt.
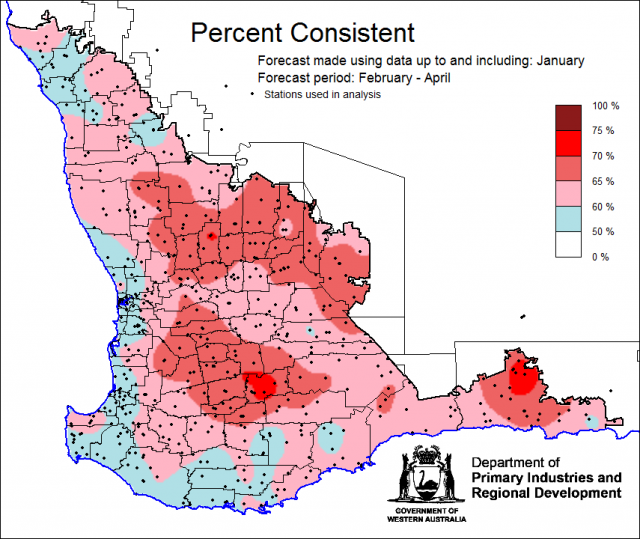
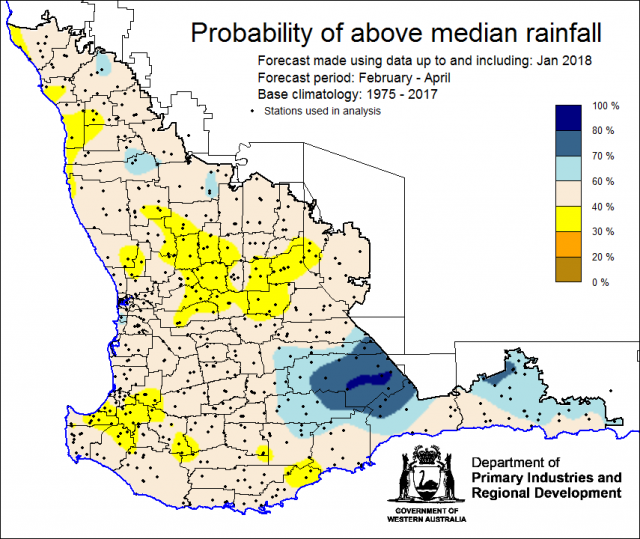
- The SSF is indicating a 40-60% chance of exceeding median rainfall for the majority of the South West Land Division (SWLD) for February to April 2018. This chance has increased to greater than 60% for the Lake Grace, Kondinin, Kulin and Esperance shires. There is a 30-40% chance for some parts of the central agricultural region. The most probable decile range map indicates decile 2-3 rainfall is most likely for the central grainbelt, with decile 8-10 rainfall for the southern grainbelt and Esperance and decile 4-7 elsewhere. Predictive skill based on January conditions is poor to good (50-70% consistent).
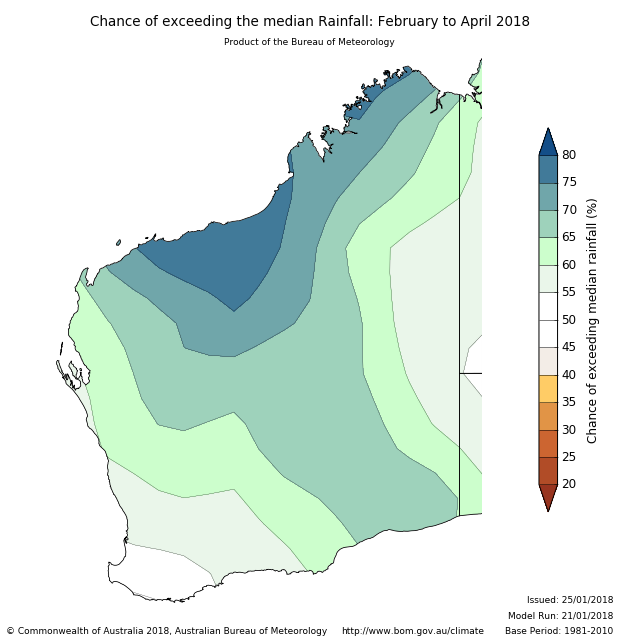
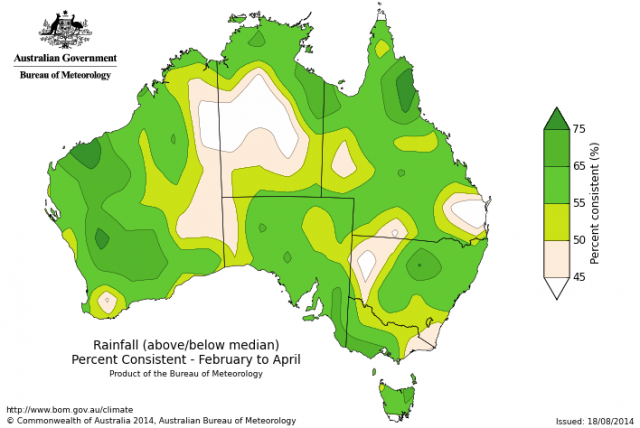
- The Bureau of Meteorology’s current seasonal outlook indicates generally a 50-60% chance of exceeding median rainfall for February to April 2018 for the SWLD. Predictive skill is poor to moderate (45-65% consistent).
- Temperature outlooks for February to April 2018 from the Bureau indicate a 30-55% chance of above normal day-time maxima for the SWLD. Skill is moderate to good at 55-75% consistent. Minimum temperature outlooks indicate a 35-55% chance of above normal night-time minima for the SWLD, with poor to good skill at 50-75% consistent.
- January rainfall in the SWLD was above average due to ex-tropical cyclone Joyce bringing rainfall in mid-January. January maximum and minimum temperatures were near average.
Three month outlook for the south-west of Western Australia
Statistical Seasonal Forecasting (SSF)
DPIRD’s Statistical Seasonal Forecast (SSF) system uses historical relationships between global sea surface temperature and sea level pressure with rainfall in south-west Australia to produce forecasts of rainfall for the coming months. Users can click on any station indicated on the map for location-specific forecast information from the Seasonal climate information page.
The SSF is indicating a 40-60% chance of exceeding median rainfall for the majority of the SWLD. This chance has increased to greater than 60% for the Lake Grace, Kondinin, Kulin and Esperance shires. There is a 30-40% chance for some parts of the central agricultural region. The most probable decile range map indicates decile 2-3 rainfall is most likely for the central grainbelt, with decile 8-10 rainfall for the southern grainbelt and Esperance and decile 4-7 elsewhere. Predictive skill based on January conditions is poor to good (50-70% consistent).

Bureau of Meteorology seasonal climate outlook
The Bureau of Meteorology’s climate outlooks are generated by a dynamical (physics based) coupled atmosphere-ocean climate model.
The Bureau of Meteorology’s current seasonal outlook indicates generally a 50-60% chance of exceeding median rainfall for February to April 2018 for the SWLD. Predictive skill is poor to good (45-65% consistent).
Temperature outlooks for February to April 2018 from the Bureau indicate a 30-55% chance of above normal day-time maxima for the SWLD. Skill is moderate to good at 55-75% consistent. Minimum temperature outlooks indicate a 35-55% chance of above normal night-time minima for the SWLD, with poor to good skill at 50-75% consistent.
Recent climate
January rainfall in the SWLD was above average due to ex-tropical cyclone Joyce bringing rainfall in mid-January. January maximum and minimum temperatures were near average.
In January the atmospheric pressure was near normal over the south-west. The Indian Ocean sea surface temperatures north-west and west of WA are warmer than normal. This enables a greater supply of water vapour and therefore an increased likelihood of above average rainfall for much of WA.
Weak La Niña conditions continue in the tropical Pacific Ocean. Models suggest the La Niña will end by mid-autumn. At this time of year, La Niña events typically start to break down, and there is a declining influence on rainfall. Past La Niñas have had little influence on south-west Western Australia (SWWA) rainfall in February.
The Indian Ocean Dipole (IOD) is neutral. Indian Ocean Dipole events are typically unable to form between December and April due to the influence of the monsoon trough over the tropical Indian Ocean. See the Bureau of Meteorology’s IOD and Pacific Ocean interaction for details.
The Southern Annular Mode (SAM), also known as the Antarctic Oscillation (AAO), describes the north–south movement of the westerly wind belt that circles Antarctica, dominating the middle to higher latitudes of the southern hemisphere. SAM is currently positive and is expected to remain positive until the end of February. In a positive SAM event, the belt of strong westerly winds contracts towards Antarctica. In spring and summer, a strong positive SAM can mean that southern Australia is influenced by the northern half of high pressure systems, and hence there are more easterly winds bringing moist air from the Tasman Sea to south-east Australia. This increased moisture can turn to rain as the winds hit the coast and the Great Dividing Range. However, a positive SAM generally has little influence on spring/summer rainfall in the SWLD.
The table below gives a summary of past month and three month SWWA climate conditions, and can be used as an indication of what is likely to occur in the near future, if climate conditions follow the current pattern.
| Climate indicator | Past month | Past three months |
|---|---|---|
| SWWA rainfall | Above average | Above average |
| SWWA mean temperature | Average | Above average |
| SWWA atmospheric pressure | Near normal | Near normal |
| Indian Ocean sea surface temperature | Warmer | Cooler |
| El Niño/Southern Oscillation (ENSO) | La Niña | La Niña |
| Indian Ocean Dipole (IOD) | Neutral | Neutral |
| Southern Annular Mode (SAM) | Positive | Positive |
Additional information
Australia's Variable Rainfall maps for annual rainfall and growing season rainfall (May to October) maps are now available from DPIRD's website. These maps show decile rainfall relative to historical records 1890-2017 and were created by the Queensland Government. The can be found under documents in the seasonal climate information page and the weather stations page.


