Recent climate
June rainfall was well below average, to record low totals in some parts of the SWLD. The early part of the growing season (April to June) was dominated by higher than average sea level pressure and clear skies, which resulted in seasonal rainfall which was well below average to record low across the SWLD.
The seasonal rainfall outlook for April to June from the Bureau indicated below average rainfall was highly likely. DPIRD’s SSF also indicated below median rainfall, with decile 2-3 rainfall most likely (see April edition of the Seasonal Climate outlook).
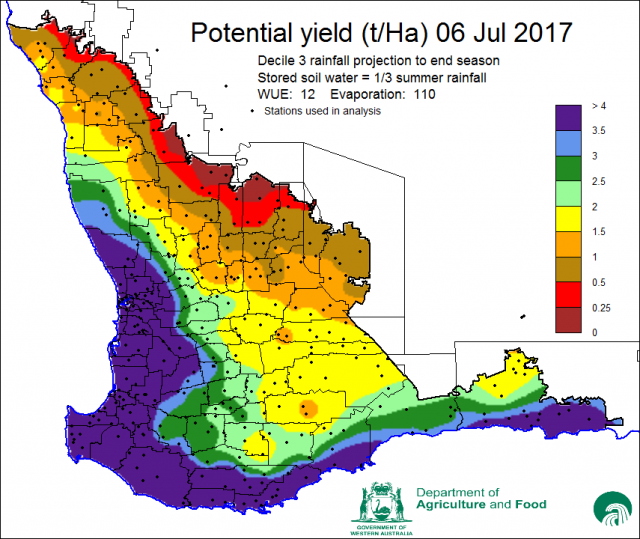
The potential wheat yield map (Figure 7) indicates low yields for the north and north-east regions in particular. The model uses observed rainfall to date at each location, with decile 3 rainfall for the rest of the growing season. This was chosen to reflect likely rainfall in coming months (see Figures 1 and 5). Importantly, the model also assumes crop has germinated in April or May, and is likely to over-estimate yields where crops have germinated late in the season.
Check the rainfall to date tool and potential yield tool for rainfall totals and modelled potential yield estimates for individual locations.

In June, the SWLD maximum temperatures were above average while minimum temperatures were mostly near-average to cooler than normal in some inland areas (likely the result of clear night skies and light winds).
Mean sea level atmospheric pressure continued to be higher than normal over the southwest. Higher than average pressure is forecast for southern parts of Australia for the next three months, which means fewer cold fronts and low pressure systems are likely to cross southern Australia.
Cooler than normal Indian Ocean sea surface temperatures, north of Western Australia have probably contributed to dry conditions by reducing moisture availability to weather systems.
The El Niño-Southern Oscillation (ENSO) status remains neutral, with tropical Pacific Ocean waters only slightly warmer than average. The majority of climate models indicate ENSO neutral conditions are likely for the second half of 2017. Accordingly, the Bureau’s El Niño outlook is classed as inactive, meaning no signs of an El Nino or La Nina developing in coming months.
The Indian Ocean Dipole (IOD) remains neutral, with half the climate models indicating a positive IOD may develop in spring. A positive IOD typically means above normal maximum and minimum temperatures for the SWLD and reduced rainfall in southern parts.
The Southern Annular Mode (SAM), also known as the Antarctic Oscillation (AAO), describes the north–south movement of the westerly wind belt dominating the middle to higher latitudes of the southern hemisphere. SAM is currently positive and is expected to remain so through July. A positive SAM can mean drier conditions for the south-west corner and northern and central wheatbelt in winter.
The table below gives a summary of past month and three month south-west Western Australia (SWWA) climate conditions, and can be used as an indication of what is likely to occur in the near future, if climate conditions follow the current pattern.
| Climate indicator | Past month | Past three months |
|---|---|---|
| SWWA rainfall | Well below average | Well below average |
| SWWA mean temperature | Above average | Above average |
| SWWA atmospheric pressure | Above average | Above average |
| Indian Ocean Sea surface temperature | Cooler | Cooler |
| El Niño/Southern Oscillation (ENSO) | Neutral | Neutral |
| Indian Ocean Dipole (IOD) | Neutral | Neutral |
| Southern Annular Mode (SAM) | Positive | Positive |
