Summary
Recent conditions: growing season rainfall (since 1 April) has been decile 1-3 for the majority of the South West Land Division (SWLD), with some locations still waiting for an autumn break. Rainfall outlook for SWLD for winter, June to August and further ahead, August to October is for below average rainfall, based on a survey of twenty international models.
Things to consider:
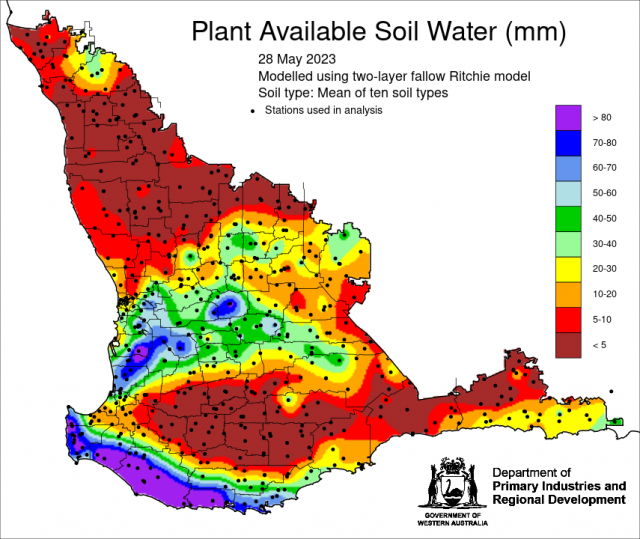
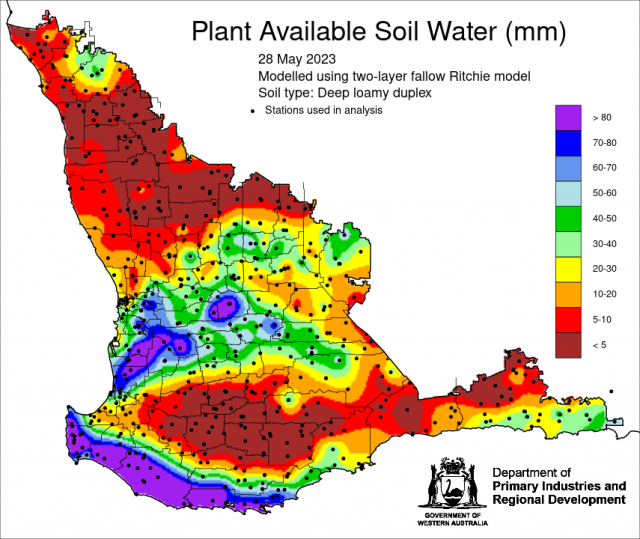
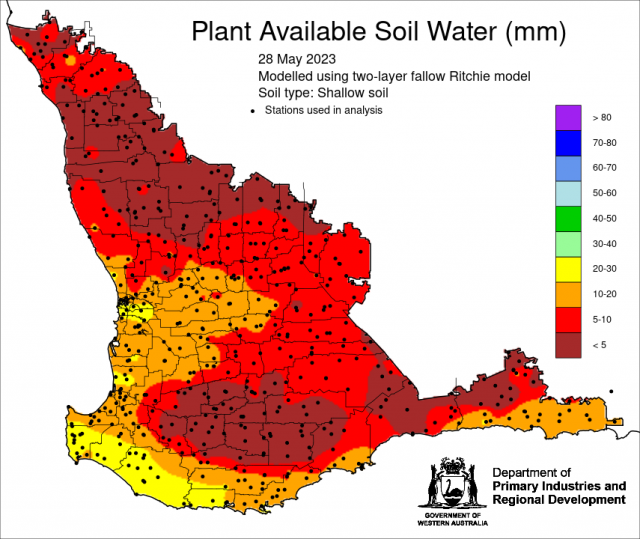
- Minimal rainfall to date for the majority of the SWLD, means limited soil water (see attached maps) with some places still looking for an autumn break (either 25 mm over 5 days or 15 mm over 3 days [for dry sowing into a furrow]). Pasture growth is suppressed and water storage on farm is minimal.
- Mean sea level pressure over the South West Land Division is forecast to be high (high pressure system) until at least September, resulting in blocking highs, which will suppress rainfall from winter cold fronts.
- Chances of both an El Niño and a positive Indian Ocean Dipole developing from June. Models indicate both events lasting through to October. If an El Niño coincides with a positive IOD, there is a clear signal for reduced winter-spring rainfall for large parts of the South West Land Division.
- The Bureau of Meteorology’s Water and the Land forecast (average of 7 models) is indicating between 5-25 mm of rain for the SWLD in the next 8 days from a cold front.
Past years with an El Niño and positive Indian Ocean Dipole
Current outlook from the Bureau of Meteorology Climate Driver update is for an El Niño to develop in the Pacific Ocean and a positive Indian Ocean Dipole in the Indian Ocean to develop in June (see below). Remember that every El Niño and IOD event is different and doesn’t always mean dry conditions.
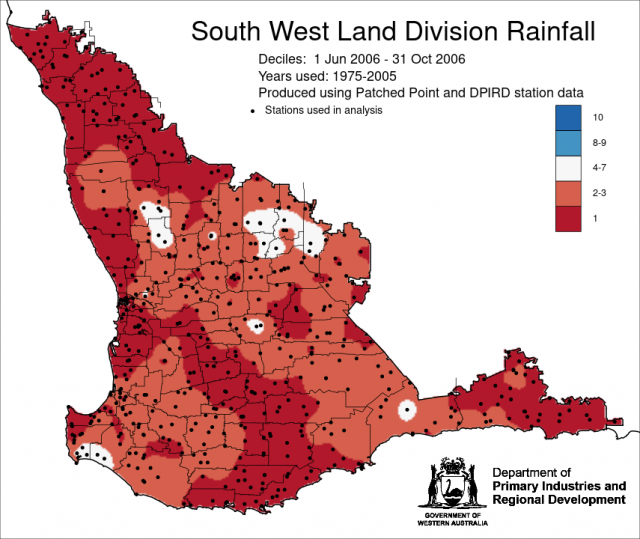
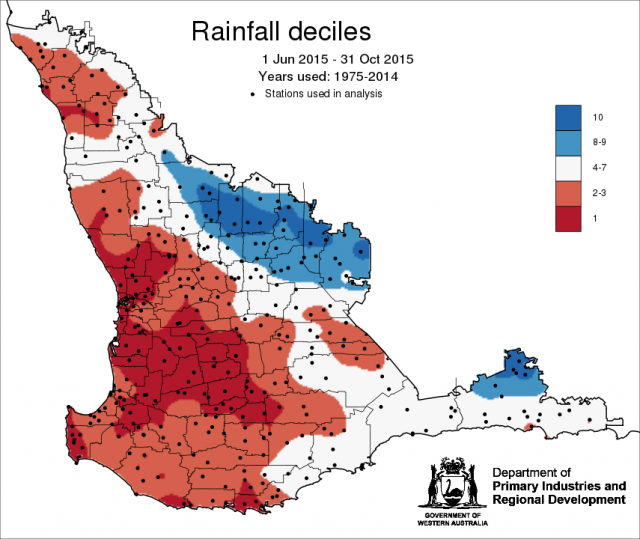
Past El Niño and positive IOD events include 2006 and 2015. June to October 2006, for the SWLD, was decile 1-3 rainfall, 2015 decile 1-3 for the majority, and decile 8-10 for eastern grainbelt and northern Esperance shire (see maps). Average wheat yields were 1.3 t/ha and 1.7 t/ha, respectively. Looking at your own rainfall records from 2006 and 2015 can give you an idea of what may happen for the reminder of the year. Examples are for Yuna, Beacon, and Ongerup.
Rainfall Outlook for the south-west of Western Australia
There are numerous models which provide precipitation outlooks for the South West Land Division. These models vary in the amount of skill they have for our part of the world.
The models display expected precipitation in different ways. Including: tercile summary (like the one from the Climate Change service [Copernicus] below), probability for lower tercile category, probability of middle tercile category, probability of lowest 20%, probability for highest 20%, probability of exceeding median, ensemble mean anomaly (mm of rainfall above or below).
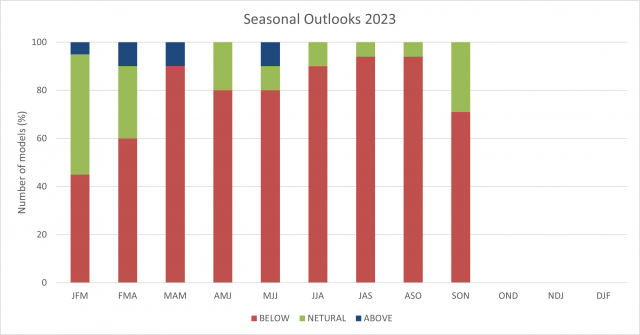
Summary of twenty national and international models show that the majority of models indicate below normal chances of exceeding median rainfall for the SWLD for winter June to August 2023, and further ahead for July to September and August to October. Survey of 7 models, also has drier conditions continuing into spring, September to November, but remember that the skill of models is poorer the further ahead they forecast.
The Bureau of Meteorology’s ACCESS-S2 (Australian Community Climate Earth-System Simulator – Seasonal) model is forecasting the higher than normal mean sea level pressure system to continue until at least September. This, together with the high chance of an El Niño in the Pacific Ocean and a positive Indian Ocean Dipole in the Indian Ocean, is contributing to the drier than normal rainfall outlook for winter and beyond.
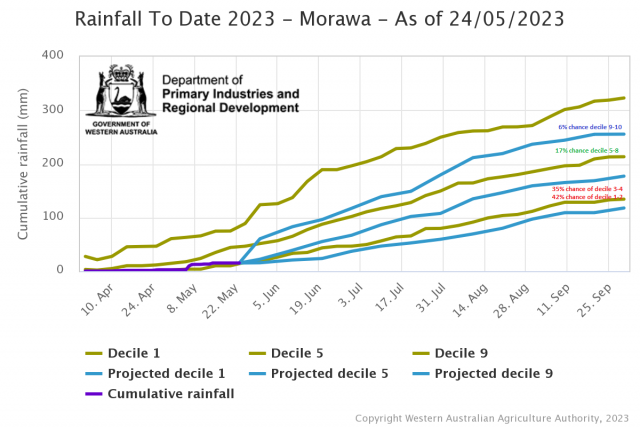
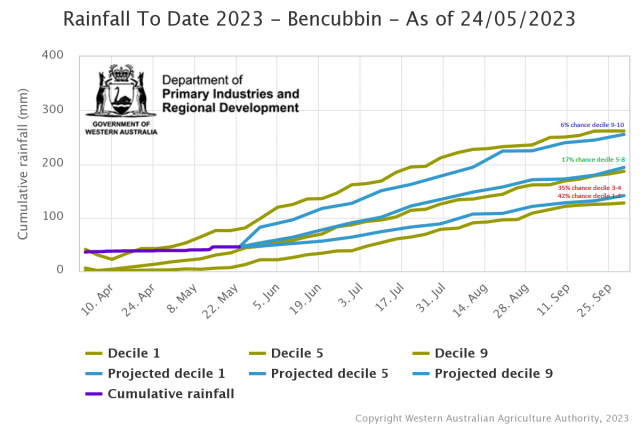
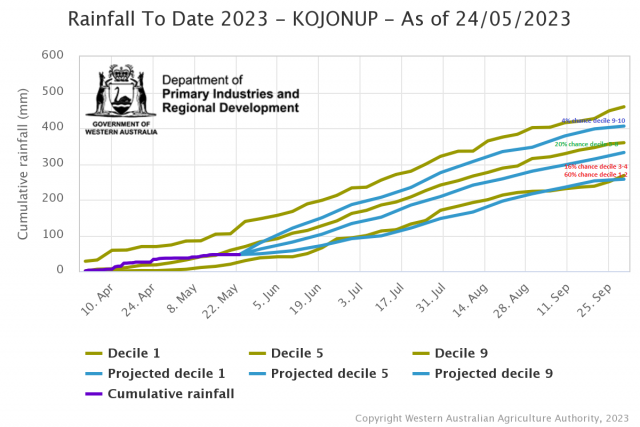
Using the Bureau of Meteorology ACCESS-S model, we can look at the chances of receiving July to September rainfall in terms of deciles, and skill of the model is pretty good at this time of the year. These examples, Morawa, Bencubbin and Kojonup use DPIRD’s rainfall to date tool.
Recent climate
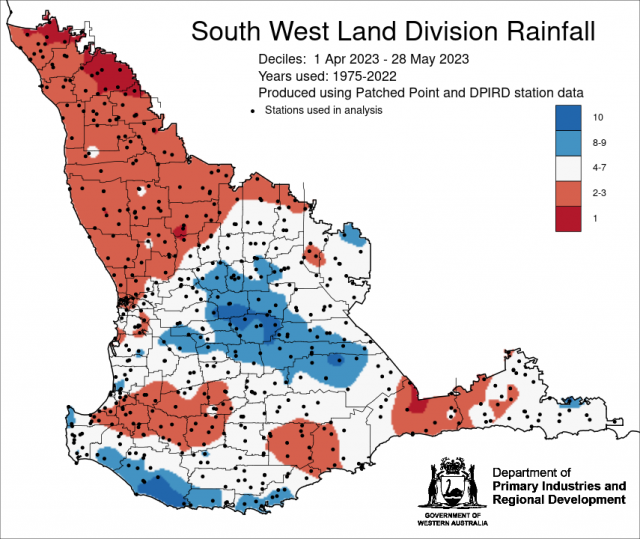
Rainfall decile map for 1 April to 28 May 2023 indicates decile 1-3 rainfall for the Central West, and parts of the Central West, parts of the South West, South Coastal and South East Coastal forecast districts. Parts of the Central Wheatbelt and Great Southern forecast districts, have received decile 8-10 rainfall. The latest plant available soil water maps using rainfall up to 27 May 2023, mean of ten soil water types, shallow soil and deep loamy duplex shown for contrast between soil types, indicates low amounts of stored soil water for the majority of the SWLD. For more information on soil water – check out the DPIRD’s soil water tool and DPIRD’s Soil Moisture Probes Network.
For information on climate drivers refer to the Bureau of Meteorology’s Climate Driver Update.

