Summary
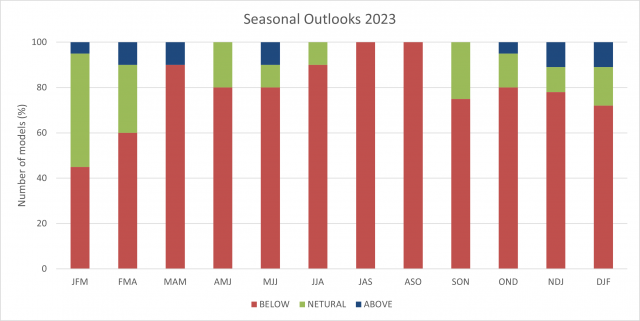
Rainfall outlook for the South West Land Division (SWLD) for the remainder of 2023, October to December, is for below median rainfall, based on a survey of 20 national and international models. Warmer temperatures than normal are also expected.
Things to consider:
- Rainfall outlook for the remainder of 2023 is for below median rainfall, with 16 out of 20 national and international models indicating drier conditions.
- Temperature outlook for the remainder of 2023 is for warmer than normal maximum and minimum temperatures. Yuna north recorded a temperature of 40.1°C in September. Frosts can still occur in October.
- An El Niño is present in the Pacific Ocean and is expected to last until at least February 2024. El Niños, have some influence on rainfall and temperatures in the SWLD, with usually below average rainfall and warmer temperatures in spring.
- A positive Indian Ocean Dipole (IOD) has developed in the Indian Ocean. This event is unusual, as models expect it to remain in place until January 2024. IOD events usually end in October, when the Australian monsoon season begins. Past positive IOD means below average rainfall and warmer maximum and minimum spring temperatures for the SWLD.
- When a positive IOD and El Niño occur together, their drying effect is typically stronger and more widespread across Australia.
- The next weak cold front is forecast to reach the SWLD 1 to 2 October with 1 to 25 mm rain forecast, with higher amounts expected along the south coast.
- The Bureau of Meteorology’s Agri-Climate Outlook for Western Australia is available on YouTube.
Rainfall outlook for the South West Land Division
A summary of 20 national and international models show that 16 out of 20 models indicate below normal chances of exceeding median rainfall for the SWLD for the remainder of 2023. Further ahead, 4 of 7 models are indicating neutral chances (neither below, nor above, median rainfall) for January to March 2024. Remember, however, the further out the model forecasts, the least skill it has.
Frost occurrence
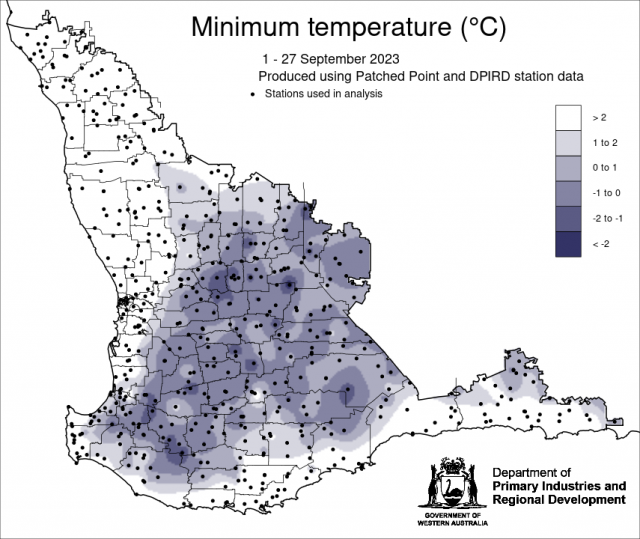
Minimum temperatures for 1 to 27 September show considerable frost occurrence in the SWLD, with Belka east recording -3.2°C and Tone Bridge recording 7 nights below 2°C.
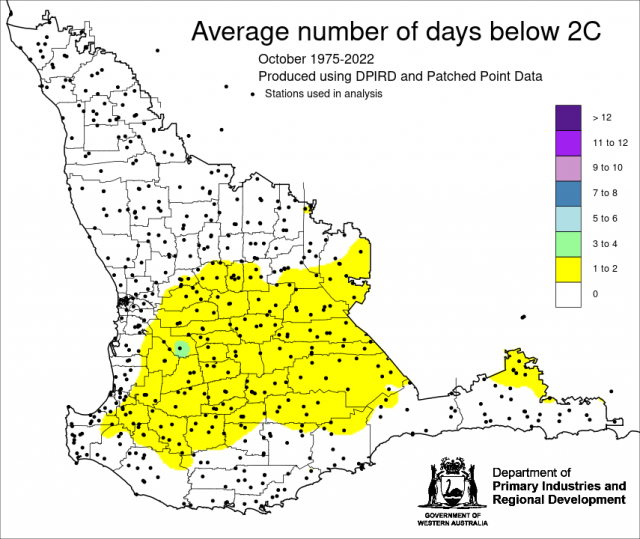
Due to the outlook of reduced rainfall for spring, the occurrence of frost, temperatures below 2°C, may be higher than normal this spring, due to reduced cloud cover. Based on October data 1975 to 2022, locations can get up to 1 to 2 frost events in October, depending on the location.
Recent climate
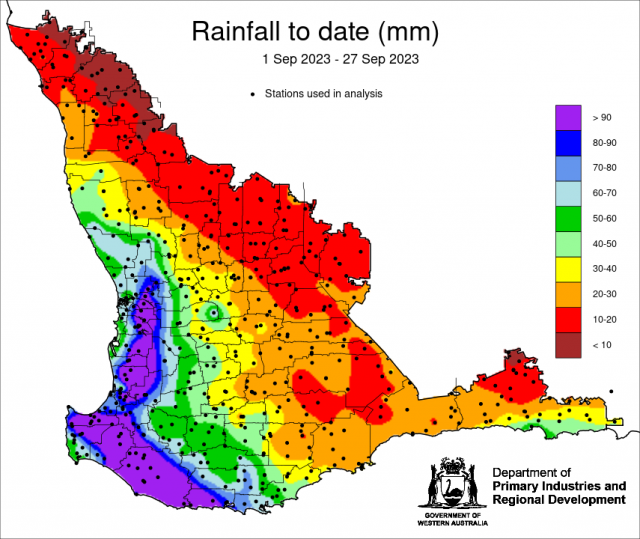
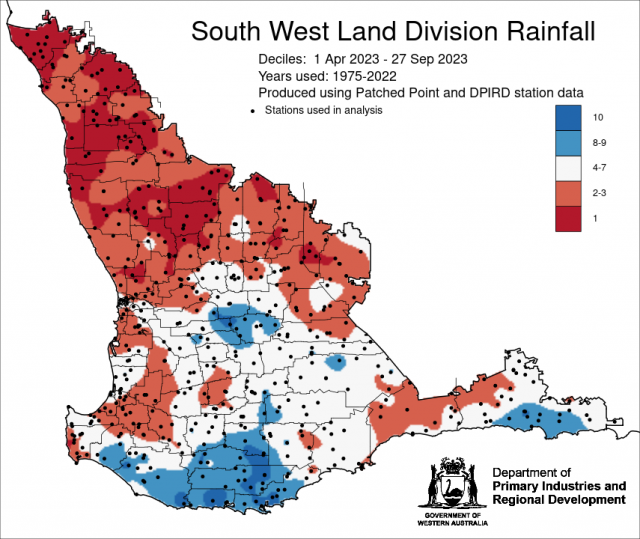
Rainfall for 1 to 27 September was average for the SWLD, with Pemberton receiving 167 mm. Rainfall decile map 1 April to 27 September indicates decile 1 to 3 rainfall for the central-west, parts of the central wheatbelt, lower west and south-west forecast districts of the SWLD. Parts of the central Wheatbelt, Great Southern, south-west, south coastal and south-east coastal forecast districts, have received decile 8 to 10 rainfall.
For information on climate drivers refer to the Bureau of Meteorology’s climate driver update.
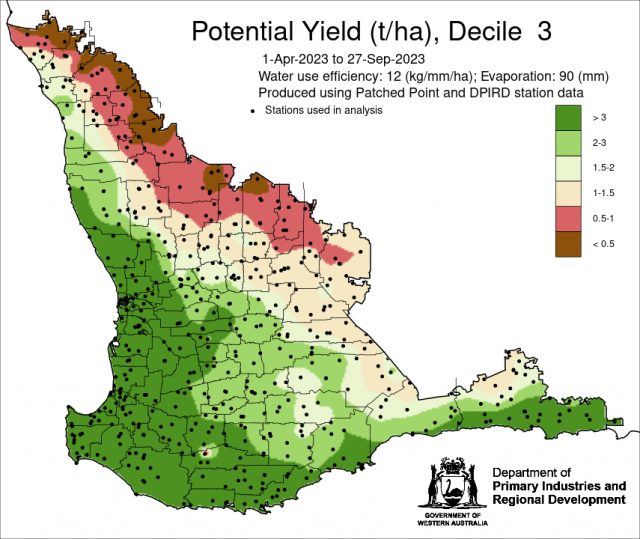
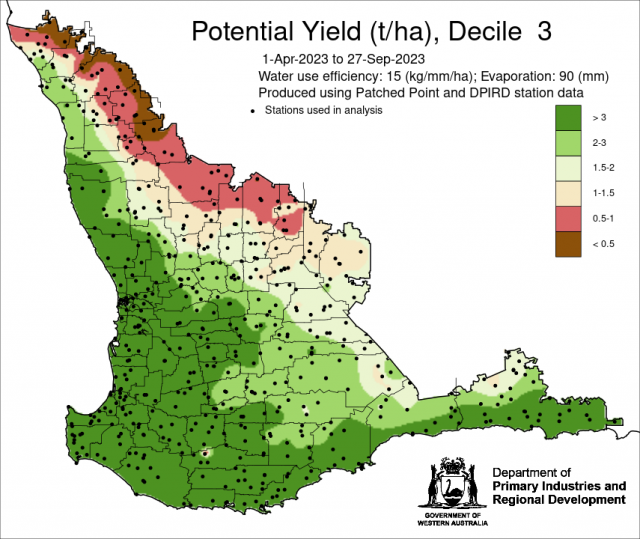
The potential yield map indicates the maximum yield possible given rainfall in the absence of any other constraints. Estimates of potential wheat yield is obtained using the French and Schultz potential yield model. Here two water use efficiency values are shown 12 and 15 kg/ha/mm and evaporation of 90 mm (for later sowing and emergence, as the majority of the SWLD had a late break this year) with a decile 3 rainfall finish (as this is what the majority of seasonal outlooks are indicating). For location specific potential yield information, with selection of evaporation and WUE, see the potential yield tool.

