Climate data for 2023 vintage
Following the previous newsletter article ‘A comparison of seasons’, a complete data set of the 2022-23 growing season is presented below. The graphs illustrate the climatic conditions which has typified the recent growing season and makes comparison to the previous season for each of WA's 9 wine regions.
The data displayed was accessed via DPIRD’s weather station and radar webpage and the Bureau of Meteorology (BoM).
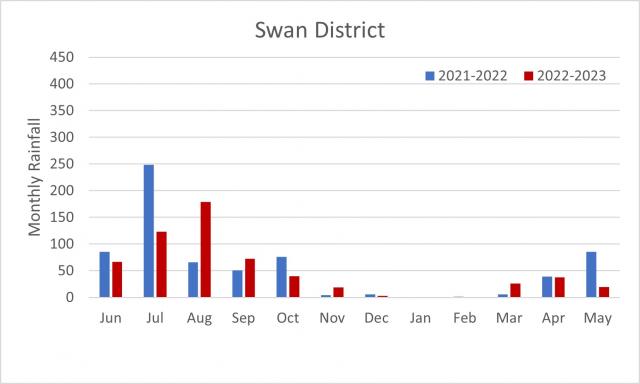
Swan District
Figure 1 and 2 show data collected from the BoM Millendon weather station (site number 9281) representing the Swan District wine region. The data shows 2022-23 was a cooler season compared to 2021-22 and that winter rainfall patterns differed between the seasons, largest falls in 2021 occurred in July whereas in 2022, August was the wettest month.

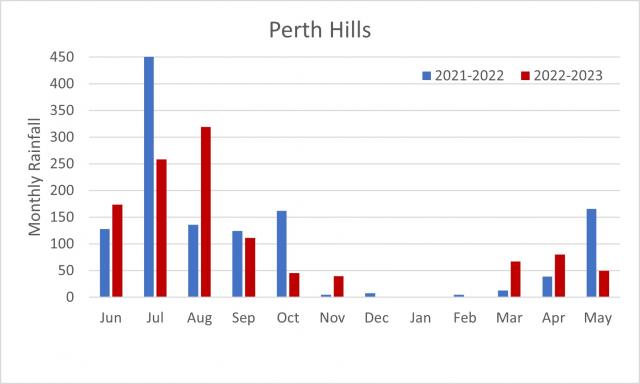
Perth Hills
Two stations were used to represent the Perth Hills, BoM station Bickley (site number 9240) and DPIRD station Glen Eagle in Figure 3 and 4. The Perth Hills experienced similar winter rainfall trends across the two seasons as the Swan Valley. The total rainfall in March and April 2023 was almost 3 times of that which fell during the same period in 2022.

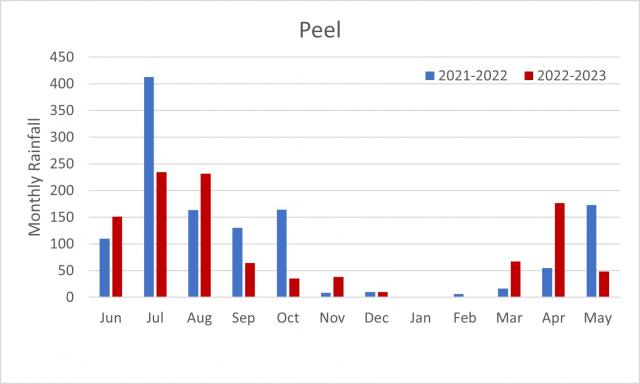
Peel
Peel’s data in Figure 5 and 6 is sourced from BoM Dwellingup weather station (site number 9538). Data from the previous 2 seasons follow similar trends to those described for Swan Valley and Perth Hills.
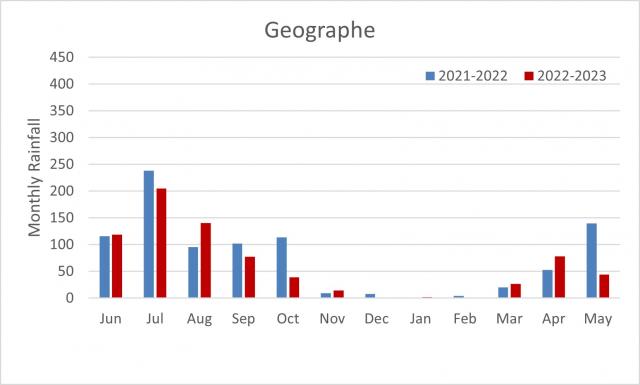
Geographe
DPIRD’s weather stations' Capel, Donnybrook and Dardanup 2 were compiled to represent Geographe in Figure 7 and 8. The 2022-23 season was slightly cooler than the 2021-22 season, while rainfall was similar.
Margaret River
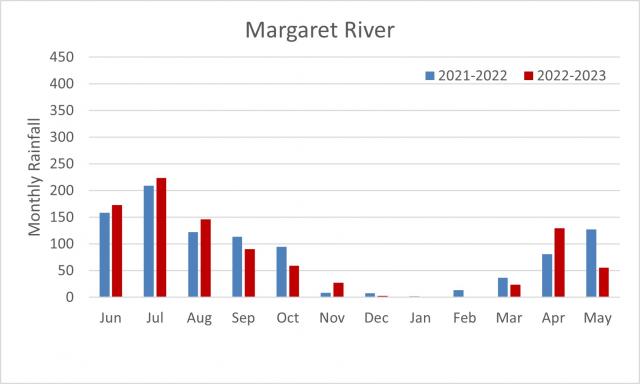
Figure 9 and 10 illustrates Margaret River’s seasonal data from DPIRD’s Vasse, Wilyabrup, Margaret River, Rosa Brook and Karridale weather stations. The 2022-23 season was around 150 GDD units cooler than the previous season. Similar rainfall patterns were experienced across the 2 seasons, but April 2023 received approximately 50mm more than April 2022.

Blackwood Valley
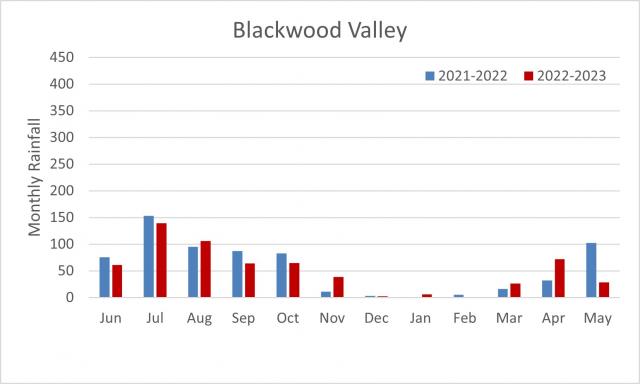
Data derived from BoM Bridgetown weather station (number 9617), DBCA station Styles Tower and DPIRD station Nannup are illustrated in Figure 11 and 12. GDD was mirrored in both seasons and around double the amount of rain fell in April 2023 (72mm) compared to 2022.

Manjimup
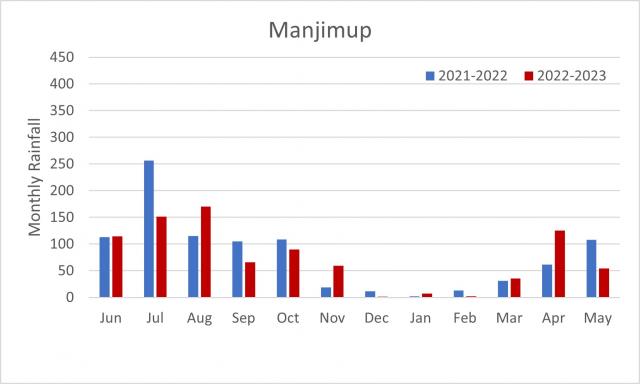
The BoM weather station at Manjimup (site number 9573) and DPIRD’s Manjimup HRS station provided data to represent Manjimup's growing season in Figure 13 and 14. The GDD data shows 2022-23 season was cooler than the previous season, but similar to Blackwood Valley. Rainfall in April 2023 (126mm) was double that of 2022.
Pemberton
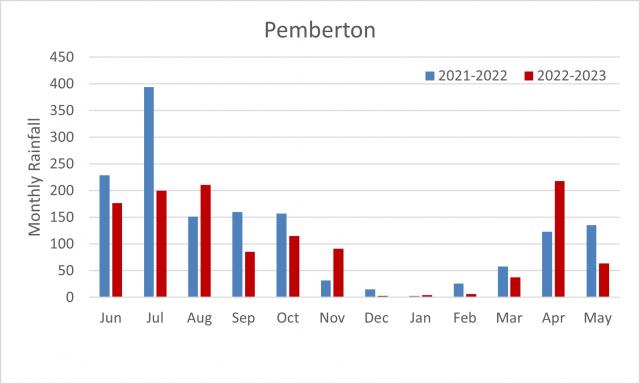
The DPIRD Pemberton weather station was the only station used in Figures 15 and 16. The data shows similar trends as those described for Manjimup, noting significant rainfall events on 13 (35mm), 23 (24mm), 24 (48mm) and 25 (54mm) April 2023.

Great Southern
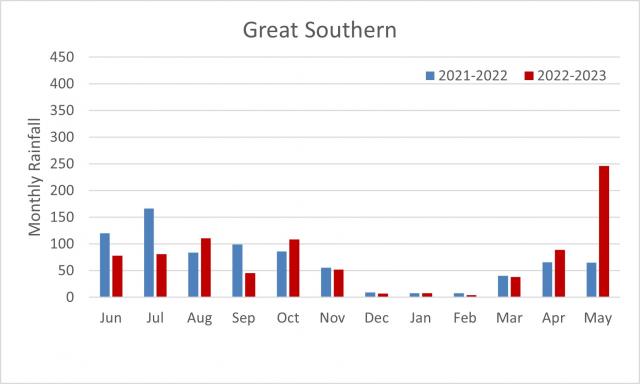
Weather stations from the subregions of the Great Southern were combined to produce Figures 17 and 18. Stations used were BoM's Albany Airport (9741) and Rocky Gully Town (9661), Water Corporation's Quickup Dam and DPIRD's Denmark, Mt Barker, Stirlings South, Frankland North and Frankland weather stations.
Of all the wine regions, Great Southern had the largest difference in GDD across the 2 growing seasons, with 2022-23 being 222 GDD units cooler than the previous season. It is also clear from Figure 18 that May 2023 received significant and consistent rainfall, averaging 8mm each day in May.

For more information on these climate summaries, contact Yu-Yi Liao.

