Predicting lambing dates using ewe-ram interactions
Kirsty Cunningham, Andrew Van Burgel, Claire Macleay, Beth Paganoni (DPIRD, WA); Khama Kelman and Andrew Thompson (Murdoch University, WA)
Author correspondence: Kirsty.Cunningham@dpird.wa.gov.au
Introduction
Lamb mortality is an economic and welfare issue for sheep producers in Australia. In Australia, about 25% of all lambs born will die, with over 80% of deaths occurring within three days after birth. Mortality rates are higher in multiple born lambs, compared to single born lambs (Oldham et al 2011, Hinch and Brien 2014, Refshauge et al 2016).
Lamb mortality can be reduced by improving ewe nutrition during pregnancy, increasing feed on offer (FOO), reducing mob size, and providing shelter during lambing. However, implementing these strategies on extensively grazed farms is often limited due to feed supply, large paddock sizes, access to sheltered paddocks suitable for lambing, and the spread of lambing dates.
The average mating period for Merino producers is almost 8 weeks (Sloane 2018, Jones and Reed 2017, Bunter et al 2018), resulting in a large spread in potential lambing dates making it difficult to maintain ewe condition score and feed on offer targets over these extended lambing periods. This can result in the condition and lambing environment potentially being suboptimal for ewes that conceive later during mating. Accurate prediction of lambing dates allows ewes with similar gestational ages to be managed to achieve targets and improve lamb survival.
On-animal sensor systems that measure changes in ewe–ram behaviours and interactions during the mating period offer potential for improving the prediction of lambing dates. This study aimed to predict lambing dates using proximity sensors for larger numbers of ewes joined with multiple rams in commercial production-sized paddocks. We reasoned that by measuring the interactions between ewes and rams during mating, as an indicator of time of oestrus, we can predict the lambing dates of ewes.
Key findings
- Use of proximity sensors identified the time of oestrus from ewe–ram interactions during mating. This allowed precise lambing date predictions assuming a gestation period of 150 days.
- The capacity to predict lambing dates will enable farmers to:
- Precisely manage cohorts of ewes with similar gestational ages during mid and late pregnancy and lambing
- Optimise ewe nutrition, lamb birthweights, access to shelter and mob sizes to increase the overall survival of lambs.
- Proximity sensors could not be used to indicate the sire of the progeny.
Materials and methods
Animals
Four hundred and sixteen maiden Merino ewes (born 2019) were mated with nine adult (2016-drop, experienced, testicles in-tact) Merino rams in 2021 on a dry cereal stubble (50 ha) for 35 days at the Katanning Research Facility.
All ewes and rams were fitted with proximity sensors and grazed together over the mating period. At 58 days, ewe pregnancy status was identified by scanning.
Sensors
GT3X v4.4.0 sensors (ActiGraph, Pensacola, FL, USA) were used to measure proximity via Bluetooth. Interactions between the ewes and rams were recorded at 30 hz over an approximate 1–15 m range every minute. A maximum of ten interactions per sensor were recorded each minute (e.g., 10 ewes within range of a ram equals 10 ewe/ram interactions; if there were more than ten ewes within about 15 m of the ram then the ten closest ewes to the ram were recorded for that minute).
Data analysis
Lamb birth dates were predicted from the ewe’s date of peak interactions (predicted date of oestrous) expressed for each ewe by a “Maximum daily interactions ratio”. The ratio (for each day and ewe combination) is calculated as the number of interactions between the ewe and all rams divided by the average number of interactions for all ewes on that day.
A gestation length of 150 days was used for all ewes as per the methods of Paganoni et al (2020), where gestation length was defined as the number of days between mating and lamb birth.
Results
Ewe and ram Interactions during the mating period
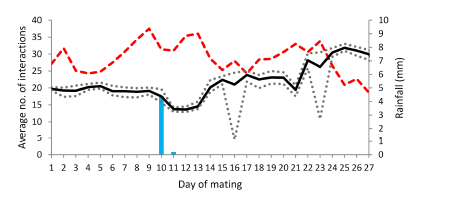
On average, a ram interacted with a ewe 22 times a day over the first 27 days of the mating period, with the average number of interactions ranging from 13 times a day (excluding battery failures) to 33 times a day. The average number of interactions increased over time, peaking at day 25 (Figure 1). Short term declines in interactions were observed on days 10–13 and 21. A reduction in the minimum number of interactions achieved per ram/day occurred on day 16 and day 23 of mating, respectively, due to partial data capture for two rams. On any given day, the variation in the average number of interactions for individual rams was small (approximately five), representing no distinct differences in social behaviour between rams.
Distribution of lambing date
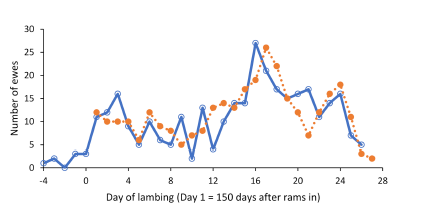
Lambing commenced on 5 June (day 4) and ended on 5 July (day 26). A total of 429 lambs were born including 206 singles and 223 multiples (from 111 ewes). The greatest number of lambs were born on day 16 (n = 27) (Figure 2, solid line).
Predicting lambing date
The predicted lambing date was within ±3 and ±6 days of the actual lambing date for 84% and 91% of the ewes, respectively (Figure 3). There was no significant difference in accuracy for single bearing verses multiple bearing ewes.
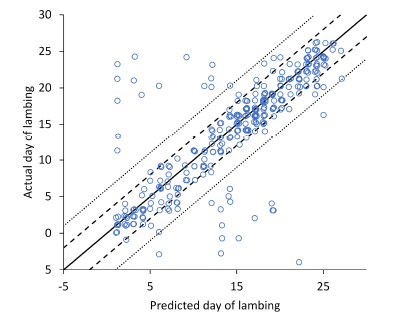
The maximum number of daily interactions for a single ewe ranged from 244 interactions/day to 1457 interactions/day. The percentage of lambing dates predicted correctly increased as the number of interactions between rams and ewes increased (Table 1).
Table 1: The percentage of predicted lambing date within 3 and 6 days of the actual lambing date for different ranges of maximum daily interactions ratio.
| Maximum Daily Interactions Ratio | Number of Ewes | Accuracy | |
| +/- 3 Days | +/- 6 Days | ||
| >3 | 1.4 | 94% | 99% |
| 2.5-3 | 62 | 90% | 97% |
| 2-2.5 | 69 | 83% | 88% |
| 1.5-2 | 59 | 73% | 85% |
| <1.5 | 23 | 52% | 57% |
| All | 317 | 84% | 91% |
Gestation length
The prediction accuracy was the highest for a gestation length of 149 or 150 days and either of these would be an acceptable choice. Prediction accuracy decreases substantially (at ±1 and ±3 days) when the gestation length is reduced to 148 days or increased to 151 days.
DNA results
The ram with maximum interactions on the estimated day of conception was only the successful sire for 16% of lambs born. Two rams were more dominant, siring 61% of all lambs born. One ram did not sire any progeny and another two sired only 3 lambs each (1%).
Discussion
Using proximity sensors to identify the time of oestrus from ewe–ram interactions during mating, and assuming a gestation period of 150 days allowed us to precisely predict the lambing date of Merino ewes under commercial production conditions. In all, 84% and 91% of actual lambing dates for all ewes were predicted within ±3 and ±6 days, respectively. The results therefore support the hypothesis that measuring ewe–ram interactions during the mating period can predict lambing dates precisely for ewes run under commercial production conditions. The capacity to predict lambing dates will enable farmers to manage cohorts of ewes with similar gestational ages precisely during mid and late pregnancy and lambing. Management of ewe nutrition, lamb birthweights, access to shelter and mob sizes can be optimised to increase the overall survival of lambs. Lambing cohorts of ewes over 7 to 13 days (±3 to ±6) could also increase the practicality of strategies to improve lamb survival, such as simplifying the management and marketing of lambs that are more uniform for age and weight. Finally, as described by Paganoni et al. (2020), more precise estimates of lambing date and hence lamb age could also improve the accuracy of estimated breeding values, especially those relating to early life growth potential.
Lamb birth dates were predicted from the day on which the ewe had the highest ratio of interactions. Initially a ewe’s maximum daily interactions ratio was calculated based on the interactions of the ewe with individual rams. However, this method was less accurate, and the DNA parentage data showed the ram corresponding with the maximum daily interactions ratio was the sire for only 16% of all progeny. This suggests that the ewes mated typically with multiple rams during oestrus, which is not entirely surprising given that Clarke et al (2021) recently reported than more than 50% of multiple born lambs from syndicate mated Merino ewes were from different sires. Our results were similar, with 37% of multiple born lambs having differing sires. We therefore concluded that, whilst proximity sensors could accurately predict the time of lambing, they could not be used to indicate the sire of the progeny.
The present study, together with Paganoni et al (2020), indicate that using proximity sensors to identify the time of conception to predict the time of lambing is likely to be less variable and more accurate than other methods, such as foetal aging using transabdominal ultrasound scanning. In contrast, the accuracy of predicting time of lambing using proximity sensors was not influenced by litter size. Given that multiple born lambs are more vulnerable to the effects of ewe nutrition, birthweight, mob size and shelter, using proximity sensors could benefit the management of multiple bearing ewes both pre- and post-lambing.
Conclusion
This study confirms that sensors to determine the proximity between ewes and rams during mating can be used to accurately identify the time of oestrus in ewes and therefore predict lambing dates under commercial production conditions. This method offers considerable advantages in comparison to current methods to predict lambing dates, such as foetal ageing, in that it is not reliant on operator skill and is less sensitive to litter size. The capacity to predict lambing dates will enable farmers to manage cohorts of ewes with similar gestational ages to be managed more precisely during late pregnancy and lambing to improve overall survival of lambs, as well as opportunities to improve lamb performance and the accuracy of breeding values. Further improvements in prediction accuracy may be achieved when mating older, multiparous ewes in smaller mating paddocks.
Full Paper
Acknowledgements
The authors acknowledge the technical assistance of staff members at the Department of Primary Industry and Regional Development’s Katanning Research Facility, and Australian Wool Innovation for use of the ActiGraph GT3X sensors.
References
Bunter K, Smith J and Fowler D (2018), ‘How accurate is foetal aging at pregnancy scanning to predict lambing date?’ Proceedings of the Australian Society of Animal Production, 58, cxiv.
Clarke BE, Egerton-Warburton KL, Smith JL, Paganoni B, Martin G and Thompson, AN (2021), ‘Split paternity is high in twins born from syndicate-mated merino ewes’, Proceedings of the Australian Society of Animal Breeding and Genetics, vol 24, pp 54–57.
Hinch GN and Brien F (2014), ‘Lamb survival in Australian flocks: A review’, Animal Production Science, vol. 54, pp. 656–666.
Hocking-Edwards JE, Copping KJ and Thompson AN (2011) ‘Managing nutrition of twin bearing ewes during pregnancy using Lifetimewool recommendations increases production of twin lambs’, Animal Production Science, vol. 51, pp. 813–820.
Jones AK and Reed SA (2017), ‘Benefits of ultrasound scanning during gestation in the small ruminant’, Small Ruminant Research, vol. 149, pp. 163–171.
Lockwood A, Hancock S, Kearney G and Thompson AN (2019), ‘Reducing mob size increases the survival of twin-born Merino lambs when feed-on-offer from pasture is limited and ewes are supplementary fed during lambing’, Small Ruminant Research, vol. 173, pp. 65-69.
Oldham CM, Thompson AN, Ferguson MB, Gordon D, Kearney GA, Paganoni BL (2011), ‘The birthweight and survival of Merino lambs can be predicted from the profile of liveweight change of their mothers during pregnancy’, Animal Production Science, vol. 51, pp. 776–783.
Paganoni B, Macleay C, van Burgel A and Thompson A (2020), ‘Proximity sensors fitted to ewes and rams during joining can indicate the birth date of lambs’, Computers and Electronics in Agriculture, vol. 170, pp. 105249.
Refshauge G, Brien FD, Hinch GN and van de Ven R (2016), ‘Neonatal lamb mortality: Factors associated with the death of Australian lambs’, Animal Production Science, vol. 56, pp. 726–735.
Sloane R (2018), Australian Wool Innovation 2017 Merino Husbandry Practices Survey; Australian Wool Innovation Ltd.: Sydney, Australia.
Preliminary evaluation of the impact of visual traits on lifetime ewe performance
Peter Wahinya, Daniel Brown, Samuel Walkom (University of New England, NSW), Tracie Bird-Gardiner (DPI, NSW), Bronwyn Clarke (Murdoch University, WA), Jennifer Smith (CSIRO, NSW), Andrew Swan (University of New England, NSW)
Author correspondence: pwahiny2@une.edu.au
Introduction
Merino sheep are often visually assessed for a range of traits that are not easily evaluated by quantitative measurements (Mortimer et al. 2009). These traits contribute to the cost of production, the value of wool and meat and the welfare of the sheep; hence, they are considered valuable components within the breeding objective of Australian Merino sheep. Professional sheep classers and trained technicians currently use standardised scoring systems to visually assess sheep for evaluations by Sheep Genetics and the Australian Merino Sire Evaluation Association (Brown et al. 2007; Australian Wool Innovation 2019; Merino Superior Sires). Moderate heritabilities and low genetic correlations have been reported in the literature between some visual traits and body composition (Mortimer et al. 2009). Walkom and Brown (2016), estimated genetic parameters and relationships among some visual and production traits in the Sheep Cooperative Research Centre Information Nucleus Flocks. However, the association among early visual traits and ewe survival are largely unknown. This study utilised data from the Merino Lifetime Productivity (MLP) project (Ramsay et al. 2019) to estimate preliminary genetic relationships between visual classing traits recorded pre-selection and adult ewe measures of body composition, reproduction and survival.
Key findings
- Heritability estimates were high for body weight, eye muscle depth, fat depth, body wrinkle, breech wrinkle, breech cover and classer grade, moderate for urine stain and legs score and low for weaning rate and ewe survival.
- Low to moderate negative (favourable) genetic correlations were estimated between the visual traits and body weight and composition, reproduction, and survival traits.
- The genetic and phenotypic correlations estimated in this study were generally favourable hence consideration of visual traits in selection and classing may have beneficial effects on adult ewe performance.
Materials and methods
Data
Data was extracted for 5,916 Merino ewes from the Balmoral, MerinoLink, New England, Macquarie and Pingelly Merino Lifetime Productivity (MLP) project sites (Ramsay et al. 2019). These first generation (F1) ewes were the progeny of 134 sires and 4,266 dams. All sites provided two cohorts of F1 ewes with lifetime data up to seven years of age. Additionally, the sires and sites represent the main wool growing regions in Australia and genotypes found in Australia (Ramsay et al. 2019). The data included lifetime records (all repeat records available) for weaning rate (WR), pre-joining adult body weight (AWT, kg), live ultrasound eye muscle depth (AEMD, mm) and live ultrasound fat at the C site (AFAT, mm). The visual traits included body wrinkle, breech wrinkle, breech cover, urine stain, legs score and classer grade, as defined in Table 1. The visual traits were scored on a scale of one to five except for grade, which was scored in categories of tops (1), flock (2) and culls (3). Ewe survival was defined as the ability of ewes to survive from yearling to beyond their fourth year of age (0 or 1). Individual ewes that missed consecutive adult reproduction, body and wool trait measurements due to involuntary culling or culling for welfare reasons were assumed to have been dispersed from the flock and assigned 0 for survival. Outlier measurements beyond four standard deviations across the dataset for body weight, fat and eye muscle measurements were dropped from the analysis.
Table 1: Visual trait descriptions, age stages considered and their standard scoring scale (Australian Wool Innovation 2019)
| Trait | Description | Scores |
| Breech wrinkle (MBRWR) | Degree and quantity of wrinkle on the breech at marking (1 – no wrinkle and 5 – extensive wrinkle) | 1 - 5 |
| Body wrinkle (YBDWR) | Degree and quantity of wrinkle on the body at yearling (5 – extensive wrinkles and heavy folds of skin over the entire body) | 1 - 5 |
| Breech cover (MBCOV) | Amount of natural bare skin around the perineum and breech area at marking (5 – complete wool cover) | 1 - 5 |
| Urine (HURINE) | A score of the extent of breech, hind legs and tail wool stained by urine at hogget (5 – extensive urine) | 1 - 5 |
| Legs (PLEGS) | Overall soundness of the front and back leg and feet structure at postweaning (5 – extreme angulation at the hocks and pasterns of the back legs) | 1 - 5 |
| Grade (HGRADE) | Standard of the sheep for visual performance relative to the flock breeding objective at hogget (1 – tops and 3 – culls) | 1 - 3 |
Statistical analysis
Univariate and bivariate mixed linear models were used to estimate variance components and, genetic and phenotypic correlations between the visually assessed traits and body composition traits using the ASReml software package (Gilmour et al. 2015). Fixed effects in the models included contemporary group (flock, year of birth and management group, 97 levels), and the interaction between birth and rear type (8 levels). Additive genetic, permanent environmental and genetic group effects (182) were fitted as random. The permanent environmental effect was fitted for adult traits with repeated records. An extended pedigree with 10,546 animals from MERINOSELECT (Brown et al. 2007) was used to capture all known ancestors of the animals with data and their parents, and with genetic groups defined for base animals with unknown parents. Ultrasound fat and eye muscle depth records were adjusted for body weight (van der Werf, 2004). Variance components and heritability for survival were based on a binomial univariate model. The correlations between muscle and fat and visual traits were post-adjusted for body weight as shown by van der Werf (2004).
Results and discussion
Low heritabilities were estimated for weaning rate (0.07) and survival (0.06) (Table 2). Low heritabilities for reproduction (Walkom and Brown 2016; Bunter et al. 2019) and survival traits Breeding Plans A (Hatcher et al. 2009) have been commonly reported for Merino sheep. The heritability for fat, urine stain, leg score, classer grade, body weight, eye muscle depth, body wrinkle and breech wrinkle ranged from 0.21 to 0.64, indicating considerable genetic variation that could be exploited to improve these traits through selection. These parameters were within the ranges of estimates reported by Brown et al. (2010) and Walkom and Brown (2016). However, lower estimates for classer grade, body and breech wrinkle and legs scores for front and back legs have been estimated Mortimer et al. (2009). Future analysis using threshold models will be considered for the categorical traits.
Table 2: Data summary, genetic groups (σgg), additive genetic (σa), permanent environment σpe and phenotypic (σp) variances and heritabilities for body composition, weaning rate (WR), visual traits and ewe survival traits (full trait definitions in Table 1 and in data section)
| Trait | Records | Mean (std) | σ2gg | σ2a | σ2P | h2 |
| AWT | 15,338 | 59.06 (11.21) | 4.15 | 19.86 | 48.93 | 0.41 (0.04) |
| AEMD | 15,337 | 24.21 (3.23) | 0.30 | 2.05 | 5.22 | 0.39 (0.04) |
| AFAT | 15,331 | 3.36 (1.70) | 0.08 | 0.43 | 1.10 | 0.39 (0.04) |
| WR | 15,298 | 1.09 (0.67) | 0.03 | 0.03 | 0.42 | 0.07 (0.02) |
| YBDWR | 3,318 | 2.28 (0.84) | 0.20 | 0.14 | 0.32 | 0.44 (0.08) |
| MBRWR | 5,771 | 2.53 (0.95 | 0.21 | 0.48 | 0.76 | 0.64 (0.06) |
| MBCOV | 5,771 | 3.60 (1.11) | 0.08 | 0.17 | 0.49 | 0.34 (0.05) |
| HURINE | 2,564 | 1.71 (0.75) | 0.01 | 0.08 | 0.41 | 0.21 (0.06) |
| PLEGS | 3,824 | 2.08 (0.77) | 0.03 | 0.13 | 0.54 | 0.23 (0.05) |
| HGRADE | 5,304 | 2.00 (0.65) | 0.03 | 0.13 | 0.41 | 0.32 (0.05) |
| Ewe Survival | 5,494 | 0.77 (0.42) | 0.01 | 0.21 | 3.50 | 0.06 (0.03) |
The genetic relationships between early visual traits and adult body weight (Table 3), indicated that lower wrinkle, barer breech cover, lower urine stain, better legs and/or classer grade scores were all associated with heavier ewes. This relationship supports previous findings by Mortimer et al. (2009) and Brown et al. (2010). The association between early body and breech wrinkle scores and adult muscle and fat was also favourable, implying that plainer ewes (less wrinkle) were genetically more likely to have higher body condition. Similar results were reported by Walkom and Brown (2016) between wrinkle and joining condition scores, who also observed high genetic correlations between condition scores and muscle and fat. Ewes with more breech cover were genetically likely to have higher body fat. The positive correlation between classer grade and adult muscle and fat implies that classers favour ewes with lower body condition. This may be related to relationships between these traits and others not included in this study (wool traits for example), which is an area for further investigation. Phenotypic correlations followed a similar trend to the genetic correlations except for the positive correlation between urine stain and adult body weight and fat. Bigger and heavier ewes with longer fleece could, therefore, tend to have more urine stain.
Low and favourable genetic relationships existed between weaning rate and body wrinkle, breech wrinkle and leg scores showing that ewes with lower wrinkle and good legs would tend to wean more lambs. The relationship between urine stain and leg scores with weaning rate should be treated cautiously due to the high standard errors. The genetic correlation between classer grade and weaning rate was also negative, indicating a favourable relationship between classing and reproduction. Low phenotypic correlations were estimated between the visually assessed traits and weaning rate. Negative and moderate genetic correlations were estimated between survival and the wrinkle traits. These results suggest that plain bodied ewes with low breech cover score (barer breech) at an early age are likely to survive longer in the flock. The genetic correlations estimated between survival and breech cover, urine stains, legs and classer grade were considered not significantly different to 0. The phenotypic correlations between survival and the visual traits were also close to zero or not significantly different from zero. Further analysis of survival is required to better understand the impact of other traits.
Table 3: Genetic and phenotypic correlations between welfare traits at yearling, post-weaning or hogget stage and lifetime adult production
| Trait | AWT | AEMD | AFAT | WR | Ewe survival | |
| Genetic | YBDWR | -0.18 (0.05) | -0.06 (0.05) | -0.12 (0.06) | -0.15 (0.08) | -0.43 (0.26) |
| MBRWR | -0.09 (0.03) | -0.11 (0.03) | -0.08 (0.03) | -0.22 (0.06) | -0.46 (0.19) | |
| MBCOV | -0.33 (0.04) | 0.02 (0.04) | 0.11 (0.04) | -0.05 (0.08) | -0.01 (0.21) | |
| HURINE | -0.35 (0.08) | -0.14 (0.08) | -0.03 (0.08) | -0.21 (0.13) | -0.03 (0.29) | |
| PLEGS | -0.36 (0.07) | -0.11 (0.06) | 0.06 (0.06) | -0.23 (0.10) | 0.04 (0.27) | |
| HGRADE | -0.53 (0.04) | 0.16 (0.04) | 0.21 (0.05) | -0.24 (0.08) | -0.01 (0.20) | |
| Phenotypic | YBDWR | -0.12 (0.02) | -0.04 (0.02) | -0.17 (0.03) | -0.07 (0.02) | -0.01 (0.02) |
| MBRWR | -0.06 (0.02) | -0.13 (0.02) | -0.15 (0.02) | -0.1 (0.02) | -0.03 (0.01) | |
| MBCOV | -0.26 (0.02) | 0.05 (0.02) | 0.01 (0.04) | -0.03 (0.02) | -0.03 (0.01) | |
| HURINE | 0.21 (0.03) | -0.11 (0.03) | 0.01 (0.03) | 0.03 (0.03) | -0.04 (0.02) | |
| PLEGS | -0.16 (0.02) | -0.06 (0.02) | -0.01 (0.03) | -0.03 (0.02) | -0.01 (0.02) | |
| HGRADE | -0.42 (0.02) | 0.05 (0.02) | 0.01 (0.02) | -0.05 (0.02) | 0 (0.01) |
Conclusion
The genetic and phenotypic correlations estimated in this study were generally favourable hence emphasis on visual traits prior to first selection of maiden ewes into the breeding flock may have beneficial effects on adult ewe performance. This was a preliminary analysis and after data collection is completed a more comprehensive analysis will be conducted.
Full Paper
Acknowledgements
The authors acknowledge Australian Wool Innovation, New South Wales Merino Stud Breeders and the Merino Lifetime Productivity project sites for supporting and funding this work. The authors thank all the site managers and committees for facilitating data collection. The Australian Government supports research, development and marketing of Australian wool through AWI.
References
Australian Wool Innovation (2019) Visual sheep scores. Australian Wool Innovation: Sydney.
Brown D, Huisman A, Swan A, Graser H, Woolaston R, Ball A, Atkins K and Banks R (2007), ‘Genetic evaluation for the Australian sheep industry’, Proceedings of the Association for the Advancement of Animal Breeding and Genetics, vol. 17, pp. 187.
Brown DJ, Swan AA and Gill JS (2010), ‘Within-and across-flight genetic relationships for breech flystrike resistance indicator traits’, Animal Production Science, vol. 50, pp. 1060.
Bunter K, Swan A, Gurman P, Boerner V, McMillan A and Brown D (2019) ‘Evolution of genetic evaluation for ewe reproductive performance’, Proceedings of the Australian Society of Animal Production, vol 23, pp. 560.
Gilmour A, Gogel B, Cullis B, Welham S and Thompson R (2015), 'ASReml user guide release 4.1 structural specification.' (VSN international ltd: Hemel Hempstead)
Hatcher S, Atkins K and Thornberry K (2009), ‘Survival of adult sheep is driven by longevity genes’, Proceedings of the Association for the Advancement of Animal Breeding and Genetics, vol. 18, pp. 580.
Mortimer SI, Robinson DL, Atkins KD, Brien FD, Swan AA, Taylor PJ and Fogarty NM (2009), ‘Genetic parameters for visually assessed traits and their relationships to wool production and liveweight in Australian Merino sheep’, Animal Production Science, vol. 49, pp. 32.
Ramsay A, Swan A and Swain B (2019), ‘Design and purpose of the Merino Lifetime Productivity Project’, Proceedings of the Association for the Advancement of Animal Breeding and Genetics, vol. 23, pp. 512.
van der Werf JHJ (2004), ‘Is it useful to define residual feed intake as a trait in animal breeding programs?’, Australian Journal of Experimental Agriculture, vol 44, pp. 405.
Walkom S and Brown D (2016), ‘Genetic evaluation of adult ewe bodyweight and condition: relationship with lamb growth, reproduction, carcass and wool production’, Animal Production Science, vol 57, pp. 20.
2023 Southern WA sheep reproductive rates based on pregnancy scanning
Katherine Davies DPIRD Northam, WA; Andrew van Burgel DPIRD Albany, WA
Author correspondence: Katherine.Davies@dpird.wa.gov.au
The benefits of pregnancy scanning
Pregnancy scanning ewes for multiple foetuses has shown to be a valuable tool in sheep enterprises. In the October 2022 edition of Ovine Observer, John Young reported that utilising pregnancy scanning information and adopting optimum management resulted in an average 400% return on scanning investment across all flocks and times of lambing.
The dry season combined with reduced sheep prices this year mean that pregnancy scanning ewes will be an especially high value activity this season (Livestock Management 2023-2024). Pregnancy scanning allows producers to identify the poor performing or dry ewes and remove them from the flock, reducing the flock’s overall energy demand and conserving feed supplies for high performing stock.
Knowing the pregnancy status of ewes also means producers can implement different management strategies based on the number of foetuses a ewe carries. Highly productive, twin bearing ewes have a higher energy demand, and should have priority access to feed and the best lambing paddocks, aiming for condition score 3.2 at lambing to reduce ewe and lamb mortality. Single bearing ewes have a lower energy demand than twins, requiring less feed and should be managed for condition score 3 at lambing.
Our supplementary feeding calculator for pregnant and lactating ewes can help producers determine the amounts of feed required to meet these condition score targets based on the number of dry, single and twin bearing ewes in the flock.
Sheep pregnancy scanning benchmark tool
Pregnancy scanning data (anonymised) for Merino and meat breed ewes is collected by DPIRD annually from scanning providers across southern Western Australia (excludes any artificial insemination, embryo transfer and ewe lamb matings). DPIRD has just over 2.6 million individual ewe scanning records from 2015 to the current season, with over 1.7 million of those scanned for multiples.
The reproductive performance data is fed into our Pregnancy Scanning Benchmarks tool, which allows producers to compare their flock’s reproductive rate against other Merino or meat breed flocks in the Cereal Sheep Zone (CSZ) and the Medium Rainfall Zone (MRZ) with the same time of lambing.
The tool has now been updated with the latest pregnancy scanning data for multiples in 2023.
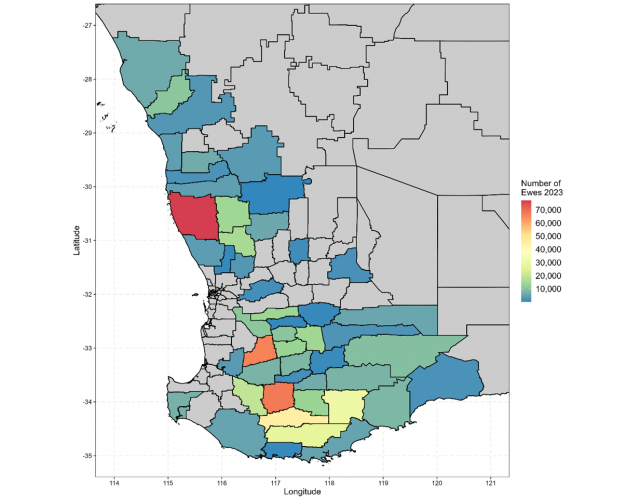
Pregnancy scanning data collected in 2023 stretches from Northampton in the north, through to Augusta-Margaret River, south to Albany and east to Ravensthorpe. Larger collections of pregnancy scanning data came from the shires of Williams, Kojonup, Dandaragan, and Cranbrook (Figure 1).
Conception and reproductive rates in 2023
Conception rate is the number of ewes scanned pregnant per 100 ewes joined and can be calculated when doing wet/dry scanning. Reproductive rate is the number of scanned foetuses per 100 ewes joined, therefore the number of foetuses per ewe is counted. This can also be called scanning for multiples or litter size. Reproductive rate reflects the potential lambing percentage, and as mentioned above, provides valuable information to optimise management.
Average conception and reproductive rates for 2023 were calculated by summing the number of ewes, dries, singles and twins across properties. This method gives equal weight to ewes (rather than properties) and therefore higher weight to larger flocks, as well as reducing the impact of outliers that typically occurred in smaller flocks.
The 2023 pregnancy scanning dataset included a total of 577,000 scanned ewes across 344 properties.
Non-merino (meat) breeds accounted for 86,000 of these scanned ewes across 60 properties, and had an average conception rate of 84%. For those properties that also scanned for multiples, the reproductive rate was 138%. Non-merino breeds were excluded from further statistical analysis between zones, time of scanning and years due to the smaller dataset.
The Merino conception rates outlined below are based on 491,000 ewes scanned across 284 properties. Of those, 287,000 Merino ewes across 148 properties were scanned for multiples and reproductive rates calculated.
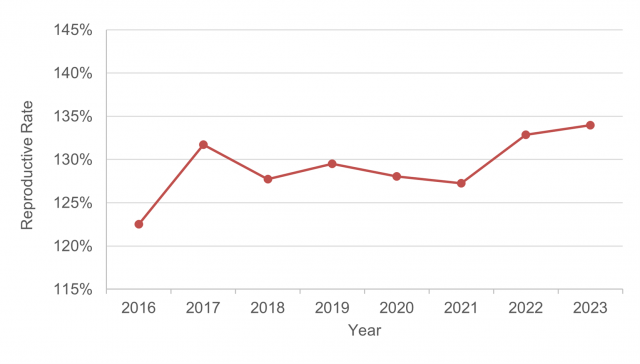
The average Merino conception rate in 2023 was 89% with a reproductive rate of 134%.
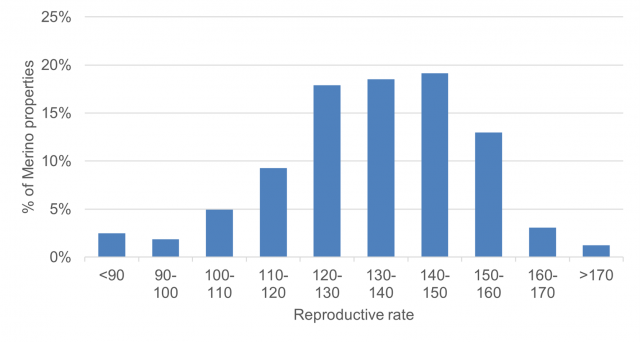
The distribution of reproductive rates is summarised in Figure 2, with the highest proportion of Merino producers having reproductive rates between 120% and 150%.
Conception rates were higher for properties with large flocks (>1000 ewes) at 89% compared to 85% for smaller flocks (<1000 ewes) (p=0.040).
Conception rates were higher for producers that scanned for multiples compared to producers that only scanned for conception (89.4% vs 87.5%; p=0.010).
The reproductive rates between the CSZ and MRZ were not significantly different. The MRZ had more singles (48% vs 41%; p<0.001) with less dry ewes and twins as summarised in Table 1.
Table 1: Percentage of dry, single and twin for Merino ewes in the Cereal Sheep Zone (CSZ) and Medium Rainfall Zone (MRZ) in 2023 based on properties that scanned for multiples.
| Zone | Dry | Single | Twin |
| CSZ | 12% | 41% | 47% |
| MRZ | 9% | 48% | 43% |
Month of scanning
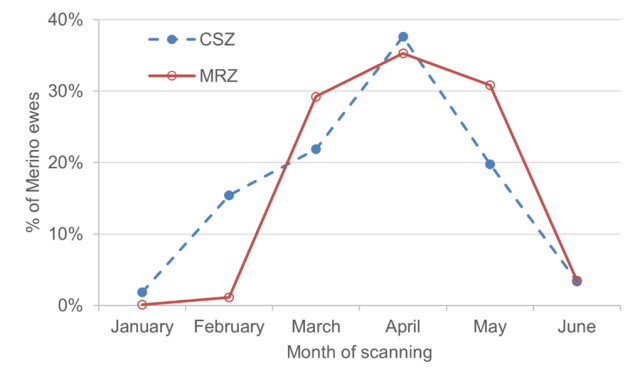
The time of scanning was earlier for the CSZ with 17% of ewes scanned by the end of February, compared to only 1% in the MRZ (Figure 3), indicating that the CSZ continues to have an overall earlier time of lambing than the MRZ.
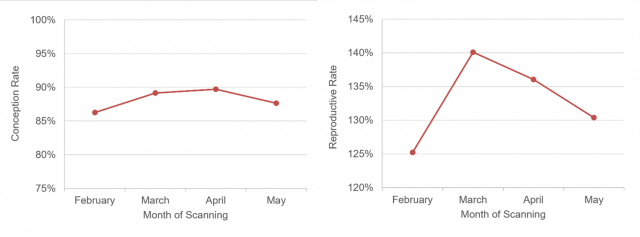
Figures 4a and 4b below illustrate the differences in Merino conception and reproductive rate as the month of scanning progressed. January and June were omitted due to little data for these months. The variation in conception rates were not significantly different between months (Figure 4a). However, the reproductive rate (Figure 4b) increased significantly between scanning in February and March (125% to 140%; p=0.018) but then decreased to May (130%; p=0.025).
Results from previous years (2022, 2021, 2020) have shown that both conception and reproduction rates generally increase as the month of scanning progresses, which is to be expected in Merinos due to their natural breeding season. However, in 2023 there was a significant decrease in reproductive rate after March scanning.
Reproductive rate trend over years
The Merino ewe reproduction rate has varied depending on the season, with the pattern following the pattern in percentage of twins. The reproductive rate of 134% in 2023 was similar to the reproductive rate of 133% in 2022, and higher than the reproductive rates in 2020 (p=0.022) and 2021 (p=0.003) (Figure 5).
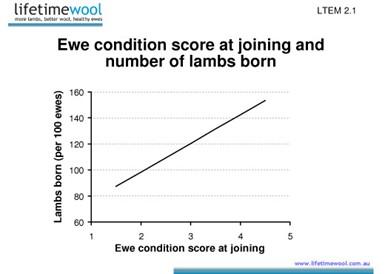
It’s likely given current seasonal conditions that average reproductive rates may decline in 2024, like they did for 2018 after the poor season in 2017. To maintain high reproductive rates going forward, producers must focus on ewe nutrition and condition score at joining, through pregnancy to lambing. Lifetime Wool data showed that for every increase of 1 condition score at joining, an extra 20 lambs are conceived (Figure 6).
In cases where feed is limited, supplementary feeding will be required to ensure ewes are in condition score 3 for joining. Work out a feed budget now, and ensure you start supplementary feeding early, before ewes start losing condition. It is much cheaper to maintain condition then it is to lose it and have to regain it for lambing.
After joining, pregnancy scanning results will allow producers to revisit their feed budgets, adjust accordingly and make decisions early on prioritising feed and lambing paddocks for highly productive stock.
Visit our Season 2023: Information for WA farmers webpage for further links to resources and calculators for feed budgeting and costing, supplementary feeding, condition scoring and confinement feeding.
A big thank you to participants in the 2022 WA Sheep Producer Survey
Further information: Janet.Conte@dpird.wa.gov.au
We would like to thank all the sheep producers who took the time to complete the 2022 survey. The survey was completed by a large, random sample of sheep producers in the Medium Rainfall Zone and Cereal Sheep Zones.
The latest survey, completed in 2022, is the fourth conducted after previous surveys in 2011, 2014 and 2018. This provided a unique opportunity to assess trends over the past decade in sheep businesses, management practices and use of technology.
Some observed trends over time include:
- Average flock size has consistently decreased.
- Average marking rates of Merino lambs, meat and maternal lambs have increased since 2011, up to 96% for Merinos and 100% for cross-bred lambs.
- The use of some technologies has increased: electronic identification and an individual data management system, sheep handler, and a remote water tank sensor and pump controller.
- Merino mulesing has increased with 82% of respondents mulesing, and 84% of all Merino lambs being mulesed in the 2022 survey.
- The use of pain relief for mulesing has increased significantly, from around half of respondents in 2011 to 90% in 2022.
- More respondents are pregnancy scanning for litter size. Just over a quarter of respondents and a third of the total ewe flock are now scanned for litter size.
- Producers are incorporating more data into their ram selection, as opposed to purely visual selection.
To read the full WA Sheep Producer Survey 2022 report, and previous years’ reports visit the Sheep Producer Survey webpage.
N-ewe StockedUp newsletter
Are you StockedUp this festive season? DPIRD is excited to reveal the n-ewe StockedUp newsletter for WA sheep and cattle industries – coming in 2024!
This quarterly publication will:
- cover research, project and staff updates
- keep you informed on the latest management and production advice
- provide a variety of resources to support seasonal challenges
- promote the latest news and livestock events.
We would like to extend an invitation to you to subscribe to the StockedUp newsletter. Simply click the link here and complete the relevant information.

