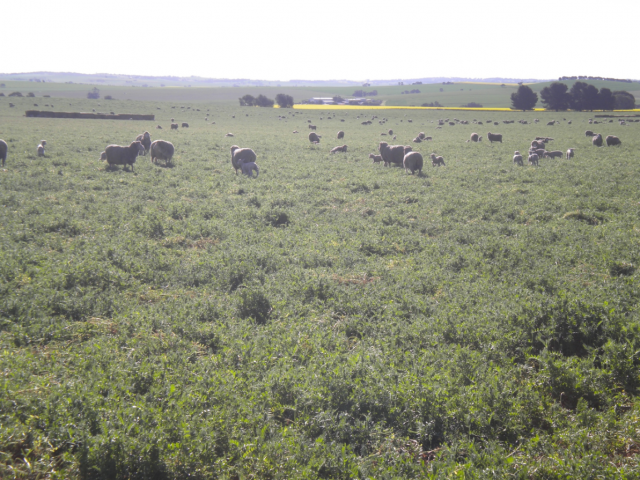
Growth of prime lambs grazing green pasture
Danny Roberts, DPIRD, Albany, WA
Author correspondence: danny.roberts@dpird.wa.gov.au
Summary
The live weight gain of unweaned, worm suppressed Merino-terminal sire born lambs was monitored from marking until October while grazing green pasture. The average growth rate over three years of mixed single and twin born prime lambs from 15 flocks on six properties was 243 grams per head per day. Live weight gains were less than expected in most flocks from late August to October with only five flocks (33%) recording more than 270 grams per head per day during this period.
Introduction
The information presented is from a project investigating the effect of winter worm burdens on prime lambs growth rates funded by MLA (B.AHE.0072). The 15 monitored flocks were on six properties located at Broomehill, Kendenup, Narrikup, Manjimup, Pingelly and Esperance.
Method
Prime lambs born to Merino ewes, mated to different terminal sires, were monitored from early June to late October on six properties from 2013 to 2015. The Merino ewes had not been pregnancy scanned and the selected unweaned prime lambs in each flock were a mixture of single and multiple births.
In an attempt to standardise the adjusted age of the lamb from each flock, repeated weighing of an average 45 lambs per flock occurred on days 51, 73, 99, and 127 after the start of lambing (SOL). Calculation of growth rates occurred for three periods – from day 51 to 98 (June to mid-August); from day 99 to 127 (late-August to October); and from day 51 to 127 after SOL (June to October). The cohort contained 50% males and 50% females. Lambs received selenium and cobalt injections and multiple anthelmintic drenches. As the unweaned lambs were worm suppressed, they were not affected by winter worm burdens. The prime lambs that were slaughtered on day 192 gained an average of 27.7 kg from lamb marking (day 51 after SOL).
Records from weather stations on or near each property of past rainfall from April to October (winter growing season rainfall) allowed calculation of the percentage of the long term average rainfall received in 2013, 2014 and 2015.
Results
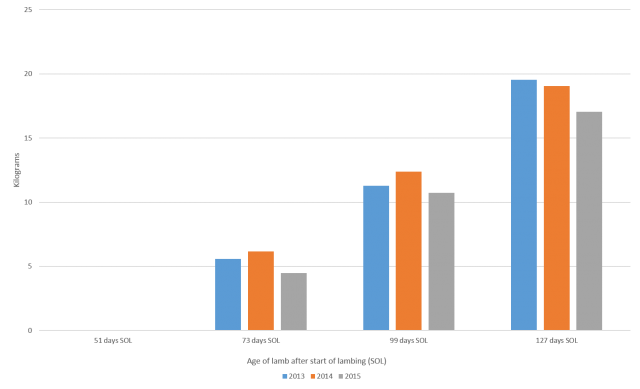
The average weight of the lambs was 36 kg (2013), 35 kg (2014) and 34 kg (2015) by October or 127 days after the start of lambing (SOL). The average gain in live weight from lamb marking to October was 19.5kg (2013), 19 kg (2014) and 17 kg (2015) as shown in figure 1. This period represents 67% of the cumulative average weight gain achieved before the prime lambs were sent to slaughter.
The decline in average growth rate of the prime lambs from marking to October mirrors the decline in the percentage of long term average winter rainfall received in 2013, 2014 and 2015, as shown in Table 1.
| Year | Average grams per head per day | Percentage of long term average winter rainfall |
|---|---|---|
| 2013 | 256 | 105% |
| 2014 | 250 | 103% |
| 2015 | 223 | 87% |
| 2013 to 2015 | 243 | 98% |
In 2015, the decline in average growth rates of lambs occurred in the 51-98 day period (June to mid-August) with a 10% reduction compared to the average of 2013 and 2014. A further 13% reduction occurred for the 99 – 127 day period.
It appears that the grazing management of each flock was critical. Some flocks achieved higher average growth rates irrespective of winter rainfall percentage, as shown in figure 2. The trend line indicates that most flocks did not gain weight at higher growth rates during years with higher percentage of winter rainfall.
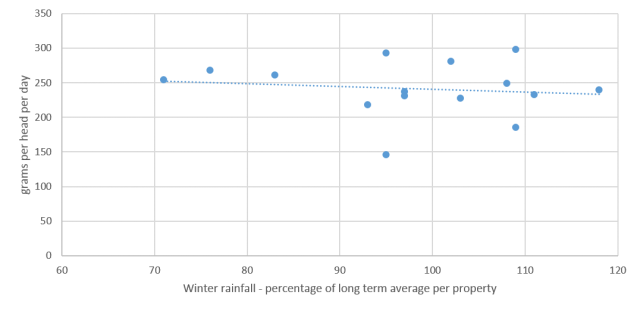
Aspirational growth rates of 300 grams per head per day are often used as a benchmark for prime lamb production. In this study, individual flocks achieved more than 300 grams per head per day in only 13% of 30 measurement periods, and none in consecutive periods.
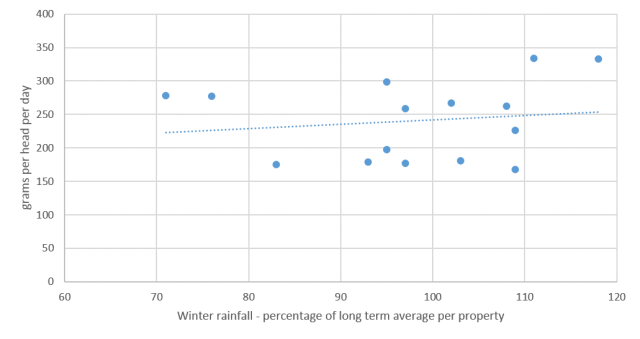
In prime lambs, the highest weight gains would most likely occur from late August to October. Average growth rates of lambs greater than 270 grams per head per day is the benchmark used in this study. Five flocks (33%) had average growth rates above 270 g/h/d for this period, as shown in figure 3. The percentage of winter rainfall received on these five properties ranged from 71% to 118% of the long term average.
Discussion
The information from this study pertains to unweaned, worm suppressed Merino-terminal sire born lambs. Grazing management was more critical for weight gain than the relative winter rainfall each property received. Only five flocks (33%) achieved gains of greater than the 270 grams per head per day benchmark from late August to October over the three years of this project. During this period, pasture growth rates are increasing, reducing any restrictions of Feed-On-Offer, pasture energy and protein content is relatively high and fibre content is low. All of these factors support high growth rates. Achieving the 270g target during this period is important because growth rates declined from October in all 15 flocks. Improving growth rates while grazing green pasture is a potential way to increase the final live weight of prime lambs at slaughter.
Precision crop stubble grazing to benefit farmers in vulnerable times
Dr Dean Thomas, Livestock System Scientist, CSIRO Agriculture and Food, Wembley WA
Author correspondence: dean.thomas@csiro.au
Summary
Crop stubbles nutritional values for grazing sheep have been reassessed for the first time in 25 years. A new tool helps farmers review their practices to get the most benefit.
Mixed enterprise farms earn their largest profits during high-yielding harvests. However, running a livestock operation – typically sheep – provides an important hedge for farm finances. By selling wool or sheep, they can help to spread business risk during inevitable drought years by providing an ongoing income stream when crops fail.
For a grain and Merino sheep farmer like Tanya Kilminster, located at Bruce Rock 250km east of Perth, effectively managing the feedbase of their livestock is an integral part of any mixed enterprise farmer’s job – one that’s complicated by decreasing rainfall.
“We know that the climate has changed – we can see it in our rainfall distribution, particularly our winter rainfall is decreasing. We understand that we are in a very variable climate and it’s about trying to capture opportunities and not have too many losses in the system,” Ms Kilminster said.
“Whilst I truly believe mixed enterprise farms can succeed in a low rainfall or variable climate, you still have to manage your stock really well and you cannot afford to not have enough feed on hand or over-graze paddocks.”
However, as a fourth-generation farmer operating a 4600-hectare property, her family has seen massive changes in how they’ve operated over the past century.
Crop stubble (or crop residue) was once seen as on-farm waste – recycled back into the soil at best or burned at worst. However, over the past few decades industry-wide attitudes towards the biomass that remains aboveground following harvest have dramatically shifted.
Growers now see it as a valuable resource to maintain groundcover. It can prevent erosion of their valuable topsoil and trap soil moisture for future crops for longer. While some 40 million tonnes of grain are typically harvested annually in Australia, a similar amount of crop stubble biomass is left in paddocks.
The value to mixed enterprise farmers who both grow crops and raise livestock is twofold. A farmer like Ms Kilminster - who grows wheat, barley, lupins and canola - also needs to consider the needs of the 2000-3500 sheep on her farm. Knowing how to properly manage crop stubble, where sheep typically spend 20% of their time, can make or break the ability to maintain groundcover to support future crops, while also acting as a feed source for livestock.
“It’s such a fine balance in the 12-month cycle of running a sheep operation in terms of their nutritional requirements and trying to manage pastures and then crop residues, while at the same time trying to look after our soils for crops,” Tanya said.
However, the last largescale assessment of crop stubble nutrients occurred almost 25 years ago. Since then farming practices, machinery and crops have changed. Climate change also threatens to increase the severity of droughts, putting economic pressure on farmers to maximise their on-farm resources.
Changing nutritional availability for livestock
New research funded by Meat & Livestock Australia and Australian Wool Innovation sought to address the changed circumstances of mixed enterprise farmers.
Lead by Dr Dean Thomas from CSIRO Agriculture and Food, a two-year project worked to quantify the value of modern crop stubbles in the face of the summer-autumn feed gap when they are a critical source of feed for sheep in the mixed farming regions.
“The recent drought highlighted the need for mixed enterprise farmers across Australia’s southern grainbelt to both protect their natural capital and utilise it effectively,” Dr Thomas said.
“Maximising the efficient use of on-farm resources like crop stubble can protect their soil and pastures during droughts and help them bounce back quicker when droughts break.”
The research team found that on average around 20% of the seasonable feedbase comes from crop stubble. Around 60% comes from green and dry pastures, and the remainder comes from forage crops, dual-purpose crops, perennial forage species, or supplementary feeding.
Crop stubbles therefore make up a large enough proportion of an animal’s energy intake, while providing an important opportunity for farmers to keep stock off their more fragile pasture paddocks over summer. Yet farm machinery has significantly improved over the last few decades, and improvements in setting design and monitoring means that headers generally leave behind less grain at harvest. The crops themselves have also changed, with canola becoming a much greater part of the national crop rotation.
“While improved machinery has increased harvest values, there is evidence of a negative impact in the nutritional value of what’s available for livestock to graze,” Dr Thomas explained.
“For instance, there has been a broad reduction in protein content of chaff, which now needs to be taken into account when managing diets and livestock performance.”
Furthermore, nitrogen content in cereal stubbles was found to have decreased by about 25% compared with previously reported values. Consequently, there may be an increased need for protein supplementation compared to historic requirements.
There is some good news for canola growers, though. The increased use of chaff lines and chaff carts means that any unharvested canola seed, high in protein and energy, will be easier to find and more likely eaten.
However, large variability between crops types, flock and paddock sizes, and animal factors such ewe weight, condition score and stage of pregnancy have left farmers needing to guestimate the value of their crop stubble for their livestock.
Consequently, as part of their research the team have been developing a decision support tool called the Stubble Grazing Calculator for farmers to use when calculating the needs for their flocks.
Recalculating crop stubble inputs
CSIRO is actively working towards developing new technologies and practices for farmers to adapt to a changing climate, which tests their ability to operate at peak productivity.
In response to this challenge, the Stubble Grazing Calculator will predict liveweight gain or loss in adult ewes based on their size, condition and reproductive status, the type and condition of crop stubble (wheat, barley or canola), and the provision of supplementary feed. Dr Thomas said the calculator is fundamentally a scenario testing tool and is designed to assist farmers estimate the number of grazing days available to stock on stubbles based on conditions in their fields and guide their next steps.
“Maximising the efficient use of on-farm resources like crop stubble can protect their soil and pastures during droughts, which should help them recover quicker with greater productivity when droughts break,” Dr Thomas said.
This means farmers can enable better-informed sequential grazing strategies, resulting in better animal welfare and production outcomes.
“It’s all about making the sheep enterprise more profitable and smoothing out the lean times to minimise economic impacts on farm budgets,” he said.
For a mixed enterprise farmer like Tanya Kilminster, the development of the crop stubble calculator is welcome help.
“People have basically been guessing on how long sheep should be grazing stubbles. The stubble calculator gives me that understanding of when crop stubbles no longer provide the nutritional value required and when to start feeding,” she said.
“You can better manage risks by having all of the information in front of you to make decisions before it becomes an emotive decision – that’s when it becomes really difficult.”
Further testing of the Stubble Grazing Calculator is now being planned to ensure that it is robust enough for widescale use by the industry.
‘Studenica’ – a new common vetch variety offering early grazing options
Stuart Nagel, Gregg Kirby and Angus Kennedy
National Vetch Breeding Program, South Australian Research and Development Institute
Author correspondence: stuart.nagel@sa.gov.au
Introduction
Traditionally vetch has been seen as a low rainfall legume best suited to sandy, neutral to alkaline soils. However trials conducted in WA and NSW at sites with lower pH soils have demonstrated that vetch can produce good yields in these soils and also offer farmers in these areas all of the benefits associated with a productive and reliable legume in their rotations.
Vetches are a multipurpose crop from the perspective of end use. During the season, vetch producers can choose the best end use option for their vetch crop. If the season is not finishing well and the crop may have insufficient water to produce good grain, it can be better to cut the crop for hay, graze it or take the opportunity to use it as green or brown manure. This can prove more beneficial in the long term than keeping an underperforming grain crop. Also it offers the opportunity to attack herbicide resistant grass weeds before they set seed and potentially provides an excellent fodder source or income in the form of hay.
Farmers in WA are seeing opportunities for using vetch in their rotations in a number of ways. To produce hay/fodder, grazing, for soil remediation and even grain. While providing these outputs vetches have the ability to offer substantial improvements in soil fertility, soil structure and organic matter as well as offering a weed and disease break for cereals in a crop rotation.
This gives farmers an extra tool in the fight against herbicide resistant weeds and cereal diseases while still offering the opportunity for a profitable enterprise in the cropping year and benefits that flow on for 2-3 subsequent crops.
Studenica, a new early maturing common vetch
Morphological characteristics
Studenica is a new white flowering variety of common vetch that will be commercially available for sowing for the first time in 2021. This variety has the earliest flowering and maturity of the common vetches, flowering in approx 85-90 days. It is rust resistant but susceptible to Botrytis, like other common vetch varieties. Studenica has toxin/anti-nutritional (BCN) levels similar to Morava.
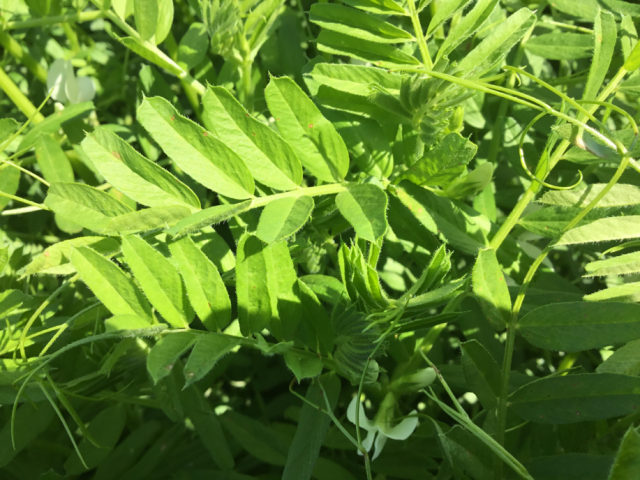
Studenica has the best early vigour of all existing common vetch varieties in Australia, combined with good cold tolerance. In early growth stages it has medium to large leaves without anthocyanin (red, purple or blue pigments), it has a medium pod size, medium seed size, greyish seed testa (protective coating) and greyish/brown cotyledons.
Main advantages
Studenica was bred for very low rainfall areas, and can be used similarly to other common vetch varieties for grain/seed, grazing, hay/silage or green manure. Studenica is particularly suited to shorter season areas where the growing season finishes sharply. It has superior winter growth when compared to existing common vetch varieties, which results in earlier nodule development and nitrogen fixation for crops in rotations.
The advantage Studenica has over other varieties is its superior winter growth and vigour combined with good frost tolerance, this enables it to put on more bulk through the cold parts of winter, continuing to grow through June/July and providing fodder earlier in the season. This variety is particularly well suited to low rainfall marginal cropping/mixed farming systems looking for early feed to fill the winter feed gap or late planting for spring fodder and hay, it offers a more reliable legume option in mixed enterprises in marginal cropping environments. Studenica has grain and hay yields comparable with Timok and Volga in most environments. It is its early growth and vigour which sets it apart, particularly in cold environments, which is demonstrated in table 2 (See Tables 1 and 2 for Studenica production data).
Its early maturity and vigour offer diversity in the system and enable this variety to be used in several different ways. It can be sown early, around Anzac day or before, for early fodder in late autumn/winter. Or sown later in the program, after the major crops, for more traditional fodder production in spring.
Yield and adaptation
Studenica has high grain and herbage yields and is well adapted to all areas of Australia where vetch is currently grown. For comparative yields see DPIRD Pulse variety sowing guide.
Studenica is well suited to situations where the season finishes sharply (dry September and October, a common issue in many low to mid rainfall areas) because of its early flowering and maturing characteristics. It can be successfully grown in many Australian soil types, from non-wetting sand to heavy clay loam with pH 5.8 - 9.4, like other common vetch varieties. Studenica is resistant to vetch rust (Uromyces viciae-fabae). Studenica shows better growth in low temperatures than other Australian vetch varieties. Studenica is not prone to pod shattering and has shown no evidence of sensitivity to the broad leaf herbicides Diuron, Simazine, Sencor/metribuzin or Terbyne, or to mixtures of these herbicides in post-plant pre-emergence treatments. It has also shown similar reactions to existing varieties when treated with grass herbicides registered for use in common vetch (Verdict or Select/Clethodim).
| Line | 2014 | 2015 | 2016 | 3yr average |
| Studenica | 2.24 | 3.09 | 2.19 | 2.51 |
| Rasina |
| 2.86 | 2.21 | 2.54 |
| Timok | 2.13 | 3.15 | 2.08 | 2.45 |
| Volga | 2.26 | 3.06 | 2.45 | 2.59 |
# Data taken from National Vetch breeding MET trials, LSD not calculated
| Line | Waikerie | Walpeup |
| Studenica | 4.81 | 3.22 |
| Morava | 3.69 | 1.71 |
| Rasina | 3.96 |
|
| Timok | 3.75 | 2.11 |
| Volga | 4.21 | 2.19 |
*Samples tested by Feedtest
| line | product | dry matter | Moisture | crude protein | ADF | NDF | Digestibility | Metabolisable energy | Water soluble Carbohydrates |
| % | % | % of DM | % of DM | % of DM | % of DM | MJ/kg DM | % of DM | ||
| Studenica | hay | 90.4 | 9.6 | 23.7 | 26.2 | 38.4 | 67.2 | 10.6 | 6.4 |
Studenica was bred, developed and trialled by the SARDI National Vetch Breeding Program in conjunction with GRDC and SAGIT and it will be available from S&W Seeds.
Conclusion
Vetches have the ability and potential to fit into modern farming rotations in WA, particularly in mixed farming systems where farmers are looking for a versatile break option that stills allows for strategic action against specific cropping problems. Unlike pulses and other break crops, the focus is not solely on grain production. Vetch can be used as a tool against herbicide resistant grass weeds and still produce a return with hay, grazing or grain and have an impact on subsequent cereals with increased levels of soil nitrogen.
Studenica can fit into this role well as it offers the option of early feed to fill the winter feed gap, or to be used to tidy up paddocks late in the cropping program.
The key to a successful vetch crop and achieving the maximum benefits from vetch is to treat it as a crop, not as a set and forget break option. Inoculate with appropriate rhizobia, control weeds where possible and monitor for insects and disease.
When successfully grown vetch can be an effective risk management tool on farm. Allowing for a reduction in fertilizer and chemical use in following crops, reducing costs and the risks involved with in crop nitrogen applications. This can have a significant impact on profitability and the stress levels associated with these decisions.
Acknowledgements
The research undertaken as part of this project is made possible by the significant contributions of Australian growers through both trial cooperation and GRDC investment. The author would like to thank these growers, GRDC, SARDI and SAGIT for their continued support and investment.
 Improving legume content of kikuyu based pastures
Paul Sanford, DPIRD, Albany WA
Author correspondence: paul.sanford@dpird.wa.gov.au
Kikuyu-based pastures frequently experience poor legume content as a consequence of kikuyu out-competing the emerging subterranean clover seedlings, many of which die due to competition for soil moisture. Other factors that lead to poor clover establishment include soil acidity, predation by red legged earth mite (RLEM) and an excess of standing kikuyu biomass that prevents light and moisture from reaching the soil surface.
There are proven methods that can be used to improve legume content in kikuyu pastures, the foremost method being grazing. Grazing kikuyu pastures heavily in the autumn pre-break of season to a residual biomass of approximately 800 to 1000 kg dry matter per ha (kgDM/ha) will open up the sward; it allows moisture and light to reach the ground and creates space in which the emerging clover seedling can develop. RLEM control is also crucial to prevent seedling losses through predation. While these approaches work well, there are situations when the producer is unable to manage kikuyu competition with these tactics leading to a kikuyu dominant pasture for much or all of the growing season. An alternative technique for reducing kikuyu competitiveness is via suppression using herbicides.
Suppressing kikuyu post-break of season
Suppressing kikuyu with glyphosate before the season break will lead to an increase in legume content within the growing season. This approach however is counterintuitive in a permanent pasture as it results in the loss of valuable out-of-season feed. The use of a grass selective herbicide following the break allows the producer to fully utilise the kikuyu out-of-season, assess whether it is likely to be a poor or good clover season and then apply the appropriate management.
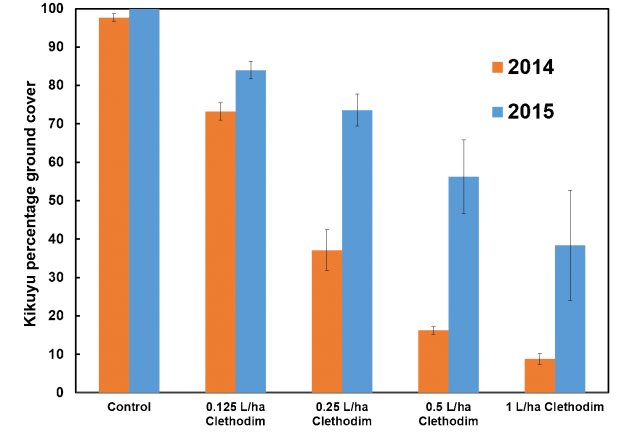
Research examining the relationship between the rate of application of the grass selective chemical clethodim and percentage kikuyu ground cover (Figure 1) has demonstrated that rates between 0.5 and 1 L/ha substantially suppress kikuyu in autumn. However, the degree to which kikuyu groundcover is diminished at the same rate of clethodim varies from season to season (Figure 1). In the case of the trial data presented in Figure 1 all of the treatments had returned to around 100% kikuyu ground cover by the following year. This is not always the case however, at another site in Denbarker recovery took longer.
Kikuyu not only competes with subterranean clover but also with weeds. The extent of this competition becomes apparent when kikuyu is suppressed as plant counts of weeds such as silver grass, capeweed and chickweed quickly change from low to high. Therefore, a weed control plan needs to be considered when suppressing kikuyu; control can be implemented either before or after kikuyu suppression.
Pasture with a good legume seed bank
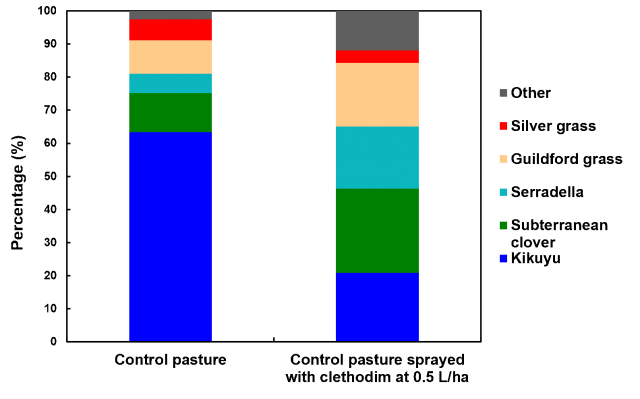
The majority of kikuyu based pastures have an adequate subterranean clover seed bank yet in some seasons many of these pastures frequently experience poor legume content. In a trial in Esperance, using the grass selective herbicide clethodim alone, we were able to increase legume content by 26% (Figure 2). However, while silver grass content decreased, guildford grass and a range of other weeds increased in response to the reduced competition from kikuyu.
At these recommended rates, clethodim is cheap and provides a method of increasing legume content in a pasture. This option should be considered when legume content is below that required to support adequate livestock production through winter and spring.
Pasture with a poor legume seed bank
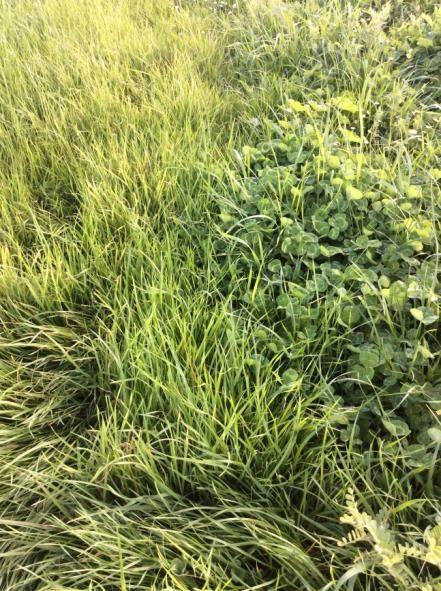
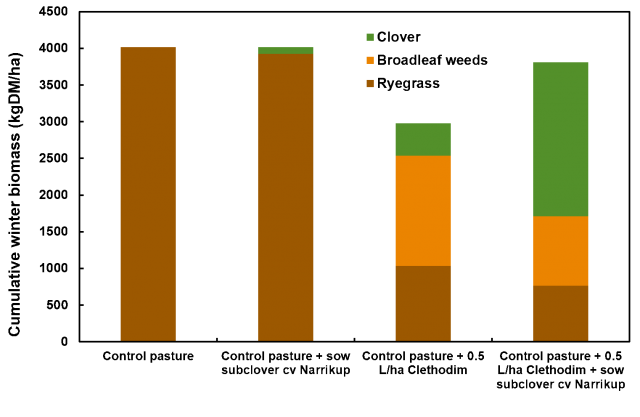
A lesser number of kikuyu pastures have a poor legume seed bank and these require both grass suppression and sowing seed to increase legume content. The trial data presented in Figure 3 demonstrates how effective the combination of suppression and sowing of subterranean clover can be in rapidly increasing the winter clover content of a kikuyu pasture compared to only sowing or suppression alone. The trial site consisted of a kikuyu/annual ryegrass pasture with complete kikuyu cover with little or no clover content. Sowing clover in April lifted the legume content to comprise 2% of the cumulative biomass in winter. Suppression of kikuyu alone with clethodim (0.5L/ha) in April increased clover content to 15% of the biomass. However, the combination of suppression and sowing substantially lifted legume content to 55% of the biomass, or 2100 kgDM/ha, compared to the control pasture which contained no clover.
The clethodim impact on annual ryegrass resulted in a loss of 1026 kgDM/ha in total winter biomass in the suppression only treatment. Most of that loss however was recovered by sowing subterranean clover in combination with suppression (Figure 3). Interestingly, in both treatments involving suppression, broadleaf weeds become a significant component of the pasture suggesting that kikuyu had been suppressing these weeds for many years.
Key messages
- Kikuyu pastures can frequently experience poor legume content.
- Subterranean clover density can be increased in kikuyu pastures by applying sufficient grazing pressure pre-break of season if there is sufficient soil moisture, insect control and space for clover seedlings.
- Legume content can be increased post break of season using a grass selective (e.g. 0.5 to 1L/ha Clethodim) to supress kikuyu; this tactic requires an adequate legume seed bank.
- If it is necessary to sow a legume as a result of a poor seed bank, suppress kikuyu and drill in the seed (do not broadcast).
- Kikuyu suppresses legumes and weeds to a greater extent than we previously thought.
For more information visit the research library.
 Case study: Remote farming drives efficiencies
(An update from a Sheep Industry Business Innovation project)
- Owners: Robyn and Chris Patmore
- Property location: Five farms in the Three Springs, Irwin, Morawa and Perenjori shires
- Property size: 10 000 hectares
- Stock: 100% sheep - 4000 Merino ewe flock and Border Leicester and Poll Dorset studs
- The eastern country is leased out for winter cropping, so the sheep graze the stubbles during summer.
- Lambing: 100-115%
- Technology: Remote monitoring cameras
- Average annual rainfall: 290mm-450mm
- Technology deployed by one Mid West sheep enterprise is driving efficiencies and delivering peace of mind.
Chris and Robyn Patmore run 4000 Merino ewes as well as Riverbend Poll Dorset and Border Leicester studs on 10 000 hectares. The stock, however, are run largely on summer stubbles on five properties across four shires from the home farm in Eneabba to Morawa and Perenjori, which poses a significant logistical challenge. During summer one of the biggest chores used to be the water run. A seven hour, 350 kilometre round trip repeated every few days. “Ninety per cent of the time when you got to the troughs there was nothing wrong and you had wasted a day and usually three quarters of a tank of fuel,” Mr Patmore said.
In 2010 the Patmores invested in their first camera designed to monitor the water troughs. Now, 16 cameras later – without even leaving the house – Mr Patmore can view a snapshot of each water point on his mobile phone. More recently, the Patmores have added a new suite of electronic monitoring devices including an electronic rain gauge, water level sensors on three water tanks, and an outflow water meter on the main storage tank.
As the sole labour unit on the farm, Mr Patmore said the value of the cameras and tank monitors went well beyond simply the dollars saved. For him it’s about being more productive and being able to do other jobs rather than just driving. His roles as chairman of the Pastoralists and Graziers’ Association livestock committee and chairman of the Central Wheatbelt Biosecurity Association also mean that he spends a bit of time off farm. The cameras enable him to still keep an eye on the watering points and even the dog while he is away. “It’s better peace of mind when you are away and better time management when you are at home,” he said. “I am still busy all of the time and I still do nearly as many kilometres on the road but I am just more productive – I can be fencing or doing other things instead of just driving around checking troughs.”
The cameras and monitors allow for as frequent checking of the troughs and tanks as desired, potentially six or eight times a day; it just takes a minute each time. “I wouldn’t be able to run the sheep scattered around the different properties without the cameras - it is just a time factor. I wouldn’t farm without them now.”
The cameras are just part of the picture. Mr Patmore is adamant that sheep don’t need to be hard work - with the right facilities. To this end he also has undercover work areas in the yards and a laneway system to make managing his stock easier.
Camera set-up
Two different brands of cameras act as remote eyes watching whether the Patmores’ sheep are drinking or if there are any problems with the water. They are the uSee remote monitoring camera and the Observant camera. Both units are solar powered and take time-lapse and on demand images. The tank monitors were purchased through WA-based company Origo Farm.
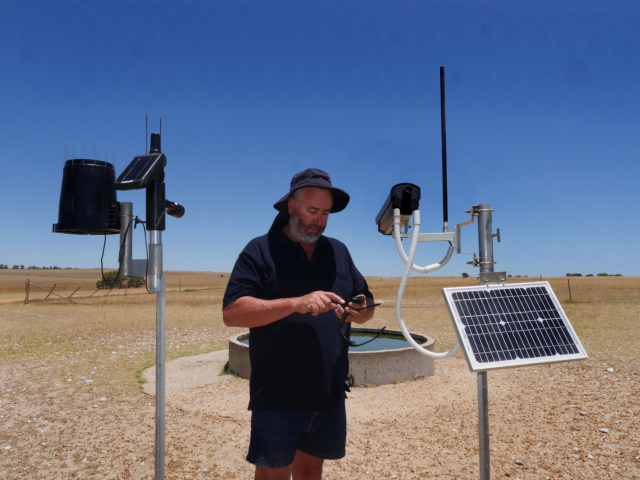
Each farm is supplied by underground water which is pumped and then gravity-fed into tanks.
Some tanks still rely on a level gauge which can be seen from a distance and come into the field of view of the cameras. The camera takes images of the trough in the foreground and tank in the background, capturing the water level in the trough and tank in one shot. On key tanks, these level gauges have been replaced with an electronic water level sensor.
Given issues of network coverage in the bush, Mr Patmore also pointed out that the devices didn’t need much of a mobile signal to still send photos or data. “You can have a camera 20 or 30 kilometres from a mobile phone tower and it still works fine,” he said. “Even if you can’t make a phone call you can usually get a photo out of the camera because they each come with a broomstick aerial which gives a lot better coverage than a normal handheld phone. “If you can’t get any signal you can use a satellite SIM card – it works out slightly more expensive but if you can’t get a Next G signal it is an option.”
Adapting the system
Mr Patmore describes the camera system as “plug and play” but has made a few of his own modifications along the way. “These cameras are set up to be mounted on a pole permanently but I have modified them to be portable, just with a thumbscrew, so they can be lifted off and you can throw them on the back seat of the ute and off you go,” he said. “When you shift a mob of sheep you shift the camera with the sheep.” Hence for the 16 mobs of sheep that the Patmores run, there are 16 remote monitoring cameras.
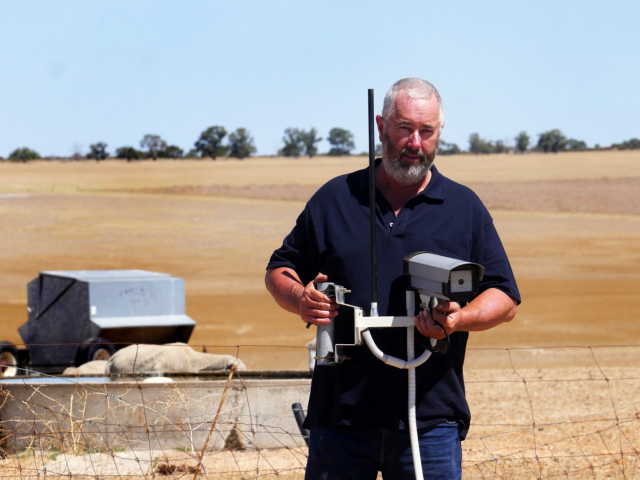
Mr Patmore showing how he can move the camera around as he moves the sheep – they are simply mounted on a piece of pipe welded onto a star picket.
Mr Patmore has found the cameras pretty reliable, apart from the odd hardware problem due to the harsh environment. The camera wires however proved not to be cockie proof. “Probably the biggest problem I have had is the cockatoos chewing the wires - so I have had to put conduit on the wires,” Mr Patmore explained. “The cockatoos also learnt to turn the switches off so I had to put shrouds over the switches.”
A picture tells a thousand words
With just the click of a button and a mobile phone the photos can be viewed from anywhere. Mr Patmore said it was simply a case of logging into the website of whichever camera system was being used and entering a username and password. His cameras are set to take photos every three hours but it is also possible to take a photo on demand. “You can take as many photos as you like per day. You have complete control over them,” Mr Patmore said.
He explained that having a visual picture was the key. “I like to be able to see the sheep are drinking – you can see them come in and have a drink,” he said. “You will see some walking towards the trough and some walking away – it’s only a still picture.
“If you see a big mob of sheep bunched before a trough and they are still there a couple of hours later you know something is wrong - there is manure in the trough or the water is all horrible and they are not drinking.
“I have been in Perth in one instance and I was watching the tank gauge go down and down but I figured I still had a day to get home and sort it out before it ran out of water. “The good thing was I knew about it - I could handle it, whereas if I hadn’t known I would have arrived back to the farm two or three days later and the sheep would have been out of water and there would have been a big panic. “So it’s peace of mind. You can get away for two or three days at a time and know that there is nothing wrong or if something does go wrong you can get something done about it.”
Business case
Mr Patmore said that capital and running costs of the technology was easily justifiable.
Economist Peter Rowe analysed the Patmore’s investment in camera technology on behalf of the Royalty for Regions-supported Sheep Industry Business Innovation project in 2017. Mr Rowe concluded the cameras had enabled Mr Patmore to cut his water runs from 60 a year to around 18, saving 42 runs.
For an initial investment of $22 500 for 15 cameras, the savings in wages and fuel and vehicle operating costs including depreciation and interest savings represented $21 400 a year.
This assumes a labour cost of $46/hr including on costs, vehicle operating cost of 70c/kilometre and that the seven hour, twice weekly, 350km run is only done for the summer months.
Mr Rowe said the Net Present Value for the investment was $142 000, at a discount rate of 6 per cent over 10 years, while the payback period for the 15 cameras was just two years.
Although the Patmores’ water run covers a few hundred kilometres, Mr Rowe said the distances travelled didn’t need to be anywhere near that for the camera technology to be profitable.
“Even if you travel five kilometres from the farm house to the back paddock and back, once a week during summer, the technology starts to pay for itself,” Mr Rowe said.
Acknowledgement
The Sheep Industry Business Innovation project was funded by Royalties for Regions and supported new technology to make running sheep easier.
Disclaimer
Mention of product names should not be taken as endorsement or recommendation.
Dry ageing sheep meat for a premium price
Robin Jacob, DPIRD, South Perth
Author correspondence: robin.jacob@agric.wa.gov.au
The project
In 2018, the Sheep Industry Business Innovation (SIBI) activity co-funded with Meat & Livestock Australia (MLA) a project to investigate the potential of dry ageing. The aim being to add value to sheep meat from animals older than lambs (hogget and cull for age mutton). In 2018, Australia produced 230 000 tonnes carcase weight equivalent of mutton, equivalent to nearly one third of the total sheep and lamb meat produced. Flock structures in WA based on merino ewes for wool production tend to produce hoggets and mutton as well as lamb.
There were four components to the project:
- Guidelines for the safe production of dry aged meat
- Market insights study
- Eating quality and yield experiment
- Economic analyses
A range of people contributed but particular thanks go to the meat science teams at the University of Melbourne and the William Angliss Institute, Melbourne.
There were many findings across the different parts of the project. The following are some highlights only. The guidelines for the safe production of dry aged meat, produced after consultation with authorities in each state of Australia, are now available on the MLA website. Anyone wishing to undertake dry ageing should check this out here.
Comparing dry versus wet ageing
Weight loss due to evaporation and trimming for sale
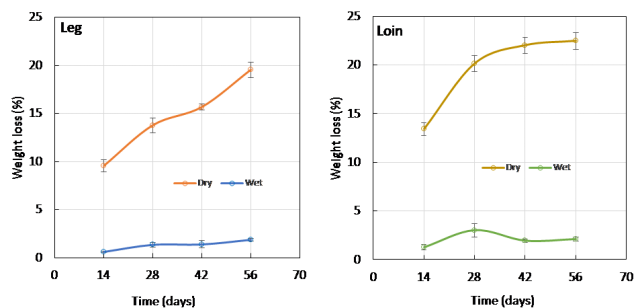
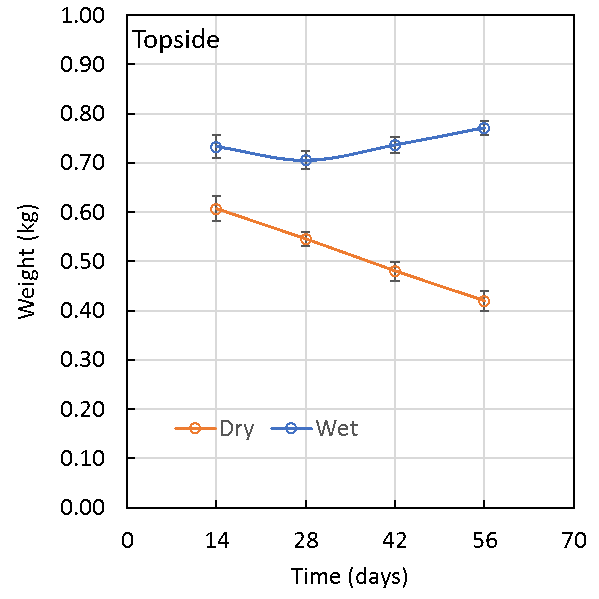
Ageing inherently caused more weight loss due to evaporation of moisture from the surface, than for wet aged mutton (Figure 1). For dry aged meat, the loss increased with ageing time and depended on the cut to some extent. Loin lost more weight than leg. The longer the ageing period the greater the weight loss in both cuts. Dry aged carcases also become increasingly more difficult to butcher as the ageing period increases, requiring more time and skill.
The commercial implications of this effect depended also on yield after deboning and fat trimming, the extent of which varied according to the cut and level of trim. The yield was lower with relatively more fat and bone removed from the loin compared to leg when prepared as a commercial cut (Figure 2). Therefore, the relative effect of dry ageing on yield was also less for loin compared to leg.
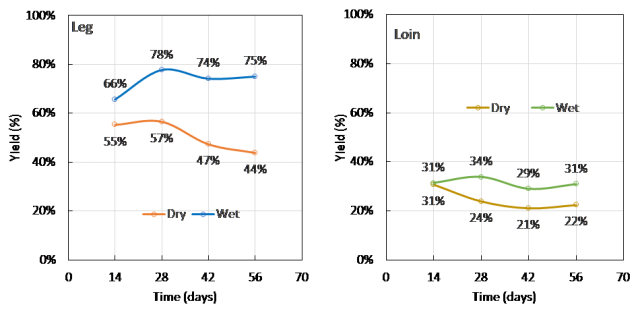
The effects of dry ageing and the length of the ageing period became even more obvious for the topside when totally denuded in preparation for sale as a single cut (Figure 3). Depending on how a butcher was to prepare a cut for retail and the length of the ageing period used, the price premium required to account for the weight loss due to dry ageing would vary. This is something that an individual business would need to determine for their own circumstances and marketing plan.
Eating quality
The project used several methods to evaluate consumer acceptance of dry aged mutton. The Meat Standards Australia (MSA) method formed the basis of the study to compare wet and dry ageing techniques. This used a standard shape of meat completely denuded of fat and grilled under standard conditions for temperature, before assessment by untrained consumers.
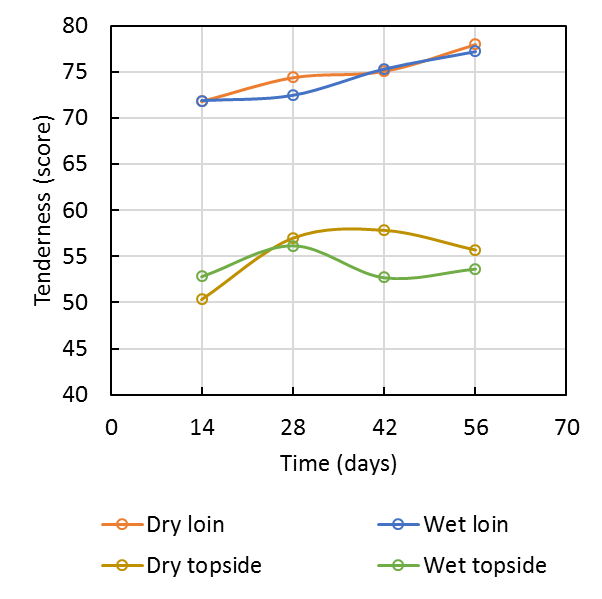
Consumer scores overall were high and within the premium category, at least for loin (Figure 4 ). This was a little unexpected but suggests that regardless of the method used, aged mutton could be valued as a table meat, if marketed and cooked appropriately.
Extending the ageing period beyond 14 days improved eating quality but not as much as was expected, from previous work on dry aged beef. Most importantly there was no difference between the ageing technique with consumers rating the meat the same for both dry and wet ageing. There was evidence from other qualitative studies with consumers that suggested differences in flavours that wasn’t detected in this wet versus dry comparison study.
Optimal aging period based on yield and eating quality
A shorter ageing period may be required for sheep meat compared to beef of 14 days to optimise tenderness for a minimal yield loss. The effect of ageing period on flavours requires further investigation.
Potential markets for dry aged mutton
The market insights work showed both a rapidly growing interest in dry ageing worldwide and an interest from chefs in both Perth and Melbourne. About 10% of the beef market in the USA is dry aged and is worth $10 billion annually. The type of consumers interested in dry aged meat are willing to spend more for meat. Any marketing campaign would need to target these groups known in the market as “voracious carnivores” or “selective foodies”.
A different cuts paradigm
The work with butchers and chefs identified ways to best utilise dry aged mutton in prepared meals as either “a centre of the plate” option or as part of a recipe. A range of dishes and recipes were prepared that can be used across a variety of restaurant formats from casual to formal dining.
Cuts considered premium may be different for aged mutton compared to lamb. For example, loin cutlets while easily fitting on a fine dining menu were relatively small and difficult to cook well after dry ageing. Cuts suited to either mince options or slow cooking methods, particularly shoulder and rump, achieved the best results. Chef feedback suggested these cuts could provide significant value add to a restaurant when considering the lunch meal occasion or more uniquely flavoured options pairing with indigenous flavours.
Industry economic analysis
Yield differences compared to wet ageing formed a major consideration for the economic analysis at the industry level. With the current data, the value of dry ageing to the industry was determined to be either small or equivocal to traditional selling methods. This would not warrant an industry scale investment in dry ageing facilities now so the opportunity to find ways to value add mutton unfortunately still exists.
Conclusions
Dry aged mutton is a safe and wholesome product when prepared correctly that can deliver a unique and premium eating experience. The recently developed guidelines outlines the systems needed to achieve this commercially. Due to the costs involved with weight loss and production, dry aged mutton will likely continue to be a specialist product, prepared by niche businesses and sold for a premium price. Whilst the “foodie” segment celebrating special occasions are the most obvious customers, some exciting opportunities still exist to add value to mutton as a more everyday product with the potential of demand increasing. If you are interested in any of the recipes, please contact the author.
 Lamb Marking rates in 2020
Mandy Curnow, DPIRD, Albany WA
Author correspondence: mandy.curnow@agric.wa.gov.au
Introduction
As part of our commitment to better understand the impacts of poor and variable seasons on lambing and turnoff rates and to map the impact on the sheep flock over the next five years, DPIRD conducts special short surveys on lamb marking rates. The data collected in 2020 adds to survey results from 2018, 2017 and 2011 to build a comprehensive picture for WA.
Marking rate (number of lambs per ewe mated) is an important measure to determine the rate of renewal of the state flock, potential turnoff and rate of genetic gain. It also an indicator of the impact of our highly variable seasons. It is often used as a measure of productivity and profitability, however, there are better metrics at a farm level such as lambs per hectare, weight of lamb turned off per hectare.
Grower Groups were contacted to canvass members for participation. Each grower group submitting completed surveys were paid a small gratuity. Twenty one grower groups participated in the survey. One hundred and seventy four (174) surveys were completed covering more than 628 000 ewes. These were represented by 250 flocks.
Results
Participants in the survey were sheep producers operating within the medium rainfall zone (MRZ) or cereal-sheep zone (CSZ).
- The cereal-sheep zone (CSZ) extends from the Geraldton area in the north west to the Esperance region in the south east. This is often known as the wheatbelt.
- The medium rainfall zone (MRZ) includes the whole south west, from the Perth area in the north, to Albany in the south. This was often known as the woolbelt.
There were a greater number of participants in the Medium Rainfall zone although the proportion of producers listed by ABS (2016) shows that 1400 sheep producers are in the MRZ and 3072 sheep producers are in the CSZ - a one-third to two-thirds split between the two production zones. There was a large difference in the number of sheep represented in the survey between zones (Table 1) and for this reason, data is presented within these zones to allow a legitimate comparison.
Seventy percent of ewes were Merinos mated to Merino sires, 12% were Merino ewes mated to meat sires and 18% were meat breeds.
| # participants | Merino-Merino joining | Merino ewes joined to meat | Meat / prime ewes joined | |
|---|---|---|---|---|
| Cereal-sheep zone | 81 | 135601 | 37820 | 9404 |
| Medium rainfall zone | 93 | 301541 | 40158 | 104109 |
| Total | 174 | 437142 | 77978 | 113513 |
Pregnancy scanning
Pregnancy scanning data for multiples to determine the Reproductive Rate (foetuses/100 ewes mated) was collected where available; however, there were only 41 Merino matings flocks, 19 Merino to meat sires flocks and nine meat flocks who scanned for multiples, some of these had incomplete data.
The reproductive rate (# of foetuses/ewe scanned) for Merino matings ranged from 71% to 148% (35 flocks); Merino to meat sire matings from 84% to 151% (10 flocks) and meat matings from 84% to 165% (8 flocks). These reproductive rates are within the average of WA flocks (Butcher, 2018). Both zones had similar reproductive rates but the CSZ had a higher average reproductive rate than the MRZ however only four flocks were represented in the sample.
For more information on pregnancy scanning rates and results in WA visit agric.wa.gov.au/sheep/pregnancy-scanning-benchmarks.
Merino flocks
Merino ewes make up approximately 85% of the state’s ewe flock and a significant proportion are mated to Merino sires to produce a wool flock and to provide ewes for matings to meat sires for lamb production. Marking rates were calculated using the number of lambs marked to the number of ewes joined.
In this survey, both zones had similar marking rates (Table 2). Overall the median and average of the zones combined, was 95%.
| Merino | # participants per zone | # of Merino flocks | Pregnancy scanning (%)* | Av Marking rate** |
|---|---|---|---|---|
| Cereal-sheep zone | 81 | 66 | 113 | 0.94 |
| Medium rainfall zone | 93 | 77 | 107 | 0.96 |
| Total | 174 | 143 | 110 | 0.95 |
*foetuses/ewe mated ** lambs marked per ewe mated
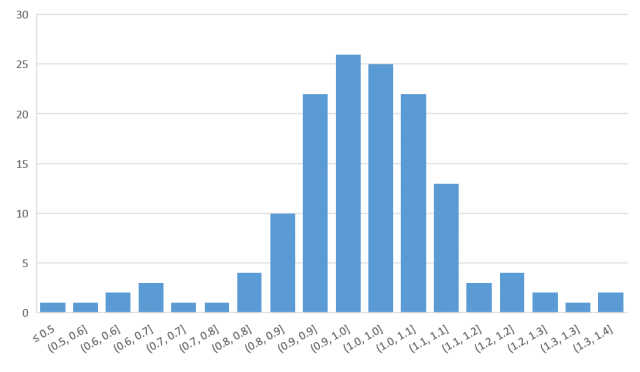
Figure 1 shows the significant variation in Merino marking rates between flocks. A similar spread in marking rates was observed in 2017 (WA Producer survey 2018).
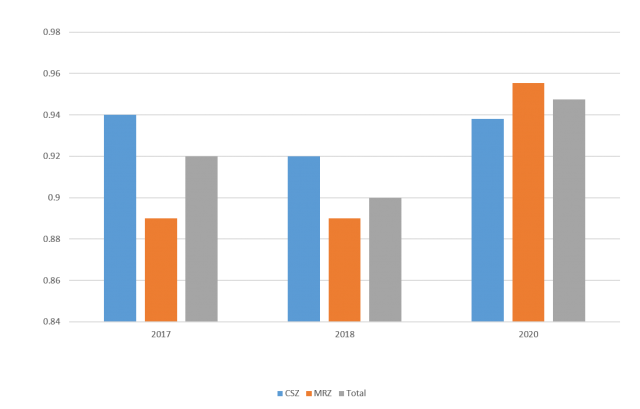
The average marking rates were slightly higher in the 2020 season compare to 2018 (WA Lambing Survey) and 2017 (WA Producer survey 2018) season (Figure 2).
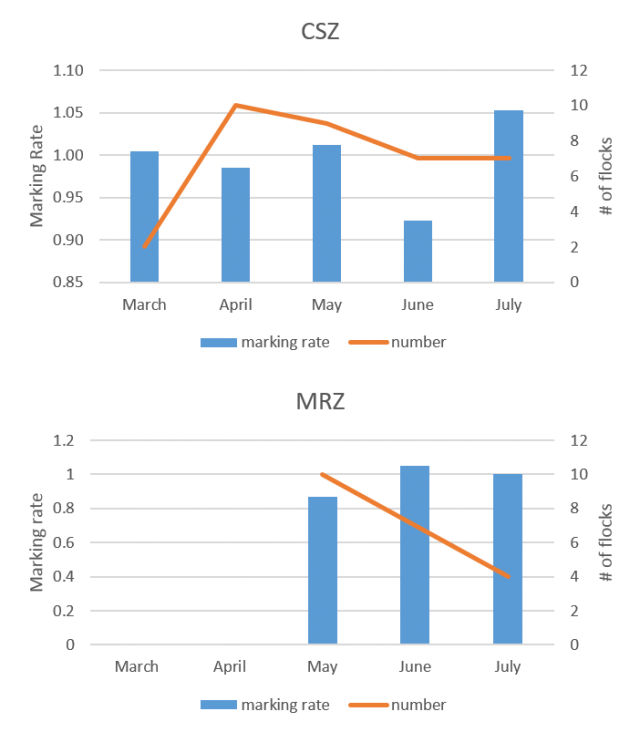
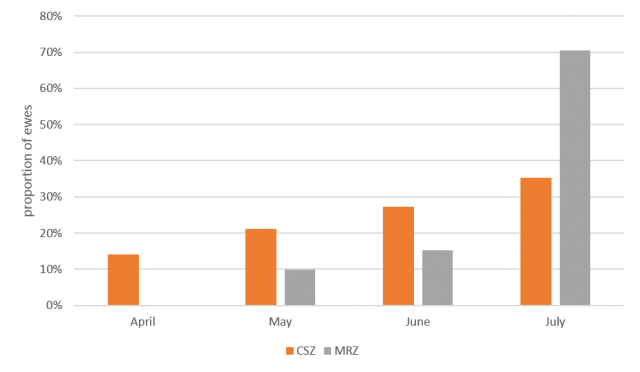
Merino producers in the CSZ tended to lamb earlier than the MRZ (Figure 3). The peak marking rate was in July (35%) with the remainder in the months February to June. Merino producers in the MRZ lambed later with a peak in marking rates in July (70%). This is different to results in the larger 2011 Producer survey (Jones & Curnow 2012) and 2018 Producer survey data (Conte & Curnow 2018) where the peak lambing for Merinos in the CSZ was May.
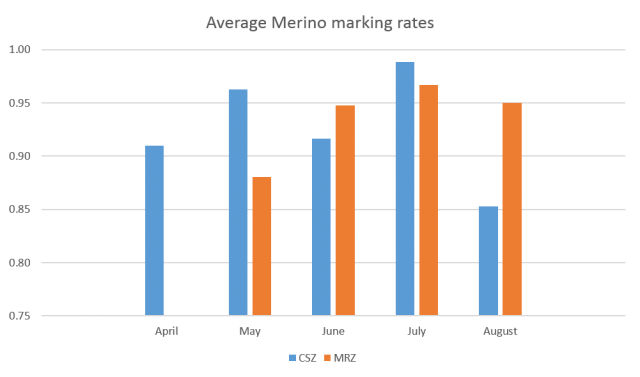
There was no clear pattern to the marking rate by month in Merino matings for the CSZ (Figure 4), however, marking rates in the MRZ peaked in July which is consistent with other surveys.
Crossbred flocks
Producers who consider themselves a dual enterprise ie. producing wool and meat, make up more than 60% of the sheep producers in WA. Many of these run dual purpose flocks which are Merino ewes crossed to a meat sire to produce and turnoff first cross lambs.
The marking rate for Merino to meat sire mating (crossbred) flocks in the CSZ was higher but not significant than that of the MRZ and the reproductive rate (pregnancy scanning %) reflected that (Table 3). The number of ewes represented in the sample is 79 000.
| # of crossbred flocks | Pregnancy scanning %* | Av Marking rate** | |
|---|---|---|---|
| Cereal sheep zone | 35 | 137 | 0.99 |
| Medium rainfall zone | 21 | 107 | 0.96 |
| Total | 56 | 110 | 0.98 |
*foetuses/ewe mated ** lambs marked per ewe mated
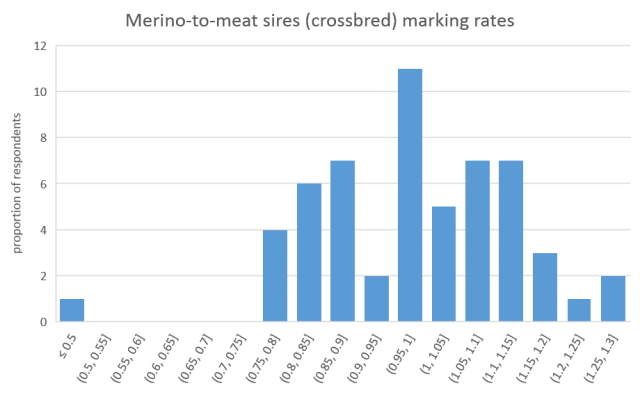
The histogram of marking rates (Figure 5) shows a similar range of marking rates to the Merino matings, albeit with one very low result which lowered the median marking rate substantially (Table 4).
| Merino x meat | |||
|---|---|---|---|
| Zone | Average marking rate | Median marking rate | |
| Cereal sheep zone | 0.99 | 1.00 | |
| Medium rainfall zone | 0.96 | 0.89 | |
| Total | 0.98 | 0.94 | |
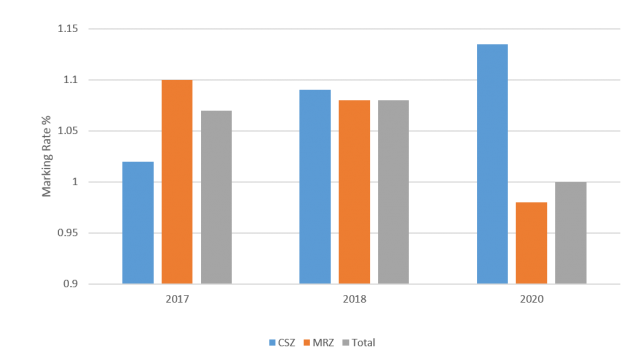
Marking rates for crossbred lambs in the MRZ for the 2020 season were significantly higher than in 2018 (Figure 6) but had a reduced sample size (40,000 compared to 113,000 ewes). The levels were similar to that achieved in 2017. Marking rates in the CSZ were remarkably consistent across the three years of surveys. This may be a related to the lower reliance on green feed at lambing and a greater reliance on supplementary feed in the autumn.
There was very little range in the marking rate by lambing month across both zones. In the MRZ, lambing was concentrated in the months of May to July whereas lambing in the CSZ was more evenly spread across March to July (Figure 7). In 2018, July recorded the lowest marking rates for crossbred flocks in the CSZ which wasn’t replicated in this sample.
Meat flocks
Meat flocks including maternals are a smaller portion of the state ewe flock but was well represented in the survey with 30% of the sample by flock.
The marking rate averaged 100% but wasn’t consistent across zones. There were very few (n=7) flocks and only 8% of the ewes represented in the CSZ in the meat to meat matings in this survey which may compromise the accuracy of these results. The results for the 44 flocks in the MRZ returned a disappointing result of 98% marking (Table 5). Of these, only six flocks were scanned for pregnancy status (with an average marking rate of 116%).
| # of Meat flocks | Pregnancy scanning %* (n=8) | Marking rate** | |
|---|---|---|---|
| Cereal sheep zone | 7 | 137.5 | 1.13 |
| Medium rainfall zone | 44 | 139.7 | 0.98 |
| Total | 51 | 139.2 | 1.00 |
*foetuses/ewe mated ** lambs marked per ewe mated
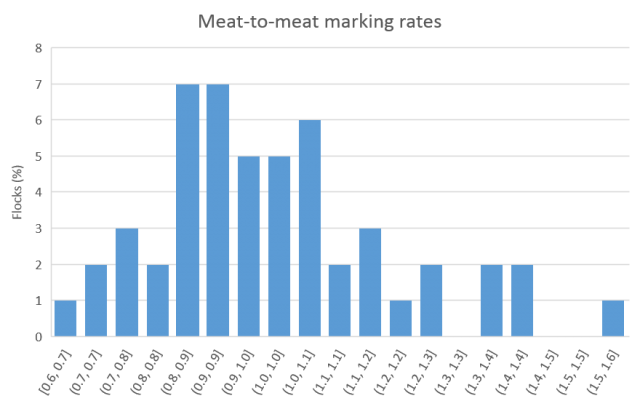
The highest proportion of flocks in meat to meat matings achieved less than 100% and it was only a small number of high performing flocks that lifted the marking rate in the MRZ (Figure 8). Using data analysed by DPIRD (Tamara Alexander, pers comm) only four meat flocks met the breakeven threshold for the marking rate required by a meat flock to offset the loss of a wool clip.
The average marking rates were higher in the CSZ in the 2020 season compared to 2018 (WA Lambing Survey) and 2017 (WA Producer survey 2018) season (Figure 9), however, the results from the 44 flocks in the MRZ performed significantly poorly compared to the 2018 and 2017 years survey.
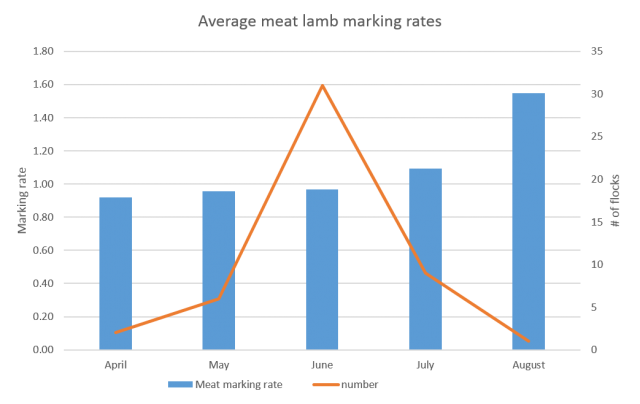
The peak month for lambing in meat flocks was June with very few flocks lambing outside of this time (Figure 10).
Ewe lambs
2020 was the first year we have asked questions about mating ewe lambs. There were 11 respondents, of which three flocks were Merino ewe lamb matings and eight were meat ewe lamb matings with a total of nearly 9000 ewe lambs.
| # participants | # ewe lambs mated | Pregnancy scanning % | Average marking rate | |
|---|---|---|---|---|
| Cereal sheep zone | 4 | 3110 | 80 | 0.44 |
| Medium rainfall zone | 7 | 5854 | 100 | 0.74 |
| Total | 11 | 8964 | 96 | 0.65 |
Overall impacts
Lambing marking data is not regularly collected on a large scale in WA. We therefore must rely on a sample of data that may mask some of the lower results; particularly in a poor season where producers maybe uncomfortable with sharing data that they see is not reflective of their usual results. Also many producers do not see the value in the collection of data or have the time or records which makes participating simple in a survey such as this. Other sources of data for lambing rates are the MLA & AWI Wool and Sheepmeat Survey conducted by the Lamb Forecasting Committee three times a year. This data will be used to build a better picture of the state’s sheep resource.
| Grower Group | Merino marking rate | Crossbred marking rate | Meat marking rate | Ewe lamb marking rate |
|---|---|---|---|---|
| ASHEEP | 0.92 | 0.93 | 1.41 | 0.56 |
| Compass Ag | 0.96 | 0.92 | ||
| Corrigin Farm Improvement Group | 0.98 | |||
| Facey Group | 1.05 | 1.21 | ||
| FEAR group | 0.90 | |||
| Gillamii Centre | 0.94 | 0.95 | 1.18 | 0.86 |
| Holt Rock Group | 0.79 | 1.06 | ||
| Liebe | 1.00 | |||
| LIFT | 0.83 | 0.95 | ||
| MADFIG | 0.90 | 0.96 | 1.05 | |
| Manjimup Pasture Group | 1.05 | 1.36 | ||
| MIG | 1.00 | 1.00 | ||
| MMPIG | 0.89 | 1.00 | 1.08 | |
| North Stirling Pallinup Natural Resources | 0.89 | 0.82 | ||
| Nyabing Farm Improvement Group | 0.94 | 0.90 | ||
| RAIN | 0.87 | 0.77 | ||
| SouthernDIRT | 1.04 | |||
| Stirling to Coast Farmers | 0.97 | 0.96 | 1.14 | 0.84 |
| Toodyay Ag Alliance | 0.80 | 0.83 | ||
| WA producer Co-op | 1.32 | 1.28 | ||
| West Midlands Group | 1.02 | 1.04 | 1.03 | 0.37 |
| N/A | 0.97 | 0.99 | 1.17 | 0.60 |
References
www.agric.wa.gov.au/sheep/western-australian-sheep-producer-surveys
Conte. J, Curnow. M, WA Producer Survey 2018, DPIRD
Jones. A, Curnow. M, WA Producer Survey 2011, DPIRD
www.agric.wa.gov.au/sheep/2018-wa-lambing-survey
Butcher. R, WA Lambing Survey 2018, DPIRD

![Smoked mutton round with purple salad and creamy fetta sauce. [Source: William Angliss, 2018] Smoked mutton round with purple salad and creamy fetta sauce. [Source: William Angliss, 2018]](/sites/gateway/files/styles/gw_large/public/Smoked%20mutton%20round%20with%20purple%20salad%20and%20creamy%20fetta%20sauce..jpg?itok=ekO_EN0r)
