 Lamb Marking rates in 2020
Mandy Curnow, DPIRD, Albany WA
Author correspondence: mandy.curnow@agric.wa.gov.au
Introduction
As part of our commitment to better understand the impacts of poor and variable seasons on lambing and turnoff rates and to map the impact on the sheep flock over the next five years, DPIRD conducts special short surveys on lamb marking rates. The data collected in 2020 adds to survey results from 2018, 2017 and 2011 to build a comprehensive picture for WA.
Marking rate (number of lambs per ewe mated) is an important measure to determine the rate of renewal of the state flock, potential turnoff and rate of genetic gain. It also an indicator of the impact of our highly variable seasons. It is often used as a measure of productivity and profitability, however, there are better metrics at a farm level such as lambs per hectare, weight of lamb turned off per hectare.
Grower Groups were contacted to canvass members for participation. Each grower group submitting completed surveys were paid a small gratuity. Twenty one grower groups participated in the survey. One hundred and seventy four (174) surveys were completed covering more than 628 000 ewes. These were represented by 250 flocks.
Results
Participants in the survey were sheep producers operating within the medium rainfall zone (MRZ) or cereal-sheep zone (CSZ).
- The cereal-sheep zone (CSZ) extends from the Geraldton area in the north west to the Esperance region in the south east. This is often known as the wheatbelt.
- The medium rainfall zone (MRZ) includes the whole south west, from the Perth area in the north, to Albany in the south. This was often known as the woolbelt.
There were a greater number of participants in the Medium Rainfall zone although the proportion of producers listed by ABS (2016) shows that 1400 sheep producers are in the MRZ and 3072 sheep producers are in the CSZ - a one-third to two-thirds split between the two production zones. There was a large difference in the number of sheep represented in the survey between zones (Table 1) and for this reason, data is presented within these zones to allow a legitimate comparison.
Seventy percent of ewes were Merinos mated to Merino sires, 12% were Merino ewes mated to meat sires and 18% were meat breeds.
| # participants | Merino-Merino joining | Merino ewes joined to meat | Meat / prime ewes joined | |
|---|---|---|---|---|
| Cereal-sheep zone | 81 | 135601 | 37820 | 9404 |
| Medium rainfall zone | 93 | 301541 | 40158 | 104109 |
| Total | 174 | 437142 | 77978 | 113513 |
Pregnancy scanning
Pregnancy scanning data for multiples to determine the Reproductive Rate (foetuses/100 ewes mated) was collected where available; however, there were only 41 Merino matings flocks, 19 Merino to meat sires flocks and nine meat flocks who scanned for multiples, some of these had incomplete data.
The reproductive rate (# of foetuses/ewe scanned) for Merino matings ranged from 71% to 148% (35 flocks); Merino to meat sire matings from 84% to 151% (10 flocks) and meat matings from 84% to 165% (8 flocks). These reproductive rates are within the average of WA flocks (Butcher, 2018). Both zones had similar reproductive rates but the CSZ had a higher average reproductive rate than the MRZ however only four flocks were represented in the sample.
For more information on pregnancy scanning rates and results in WA visit agric.wa.gov.au/sheep/pregnancy-scanning-benchmarks.
Merino flocks
Merino ewes make up approximately 85% of the state’s ewe flock and a significant proportion are mated to Merino sires to produce a wool flock and to provide ewes for matings to meat sires for lamb production. Marking rates were calculated using the number of lambs marked to the number of ewes joined.
In this survey, both zones had similar marking rates (Table 2). Overall the median and average of the zones combined, was 95%.
| Merino | # participants per zone | # of Merino flocks | Pregnancy scanning (%)* | Av Marking rate** |
|---|---|---|---|---|
| Cereal-sheep zone | 81 | 66 | 113 | 0.94 |
| Medium rainfall zone | 93 | 77 | 107 | 0.96 |
| Total | 174 | 143 | 110 | 0.95 |
*foetuses/ewe mated ** lambs marked per ewe mated
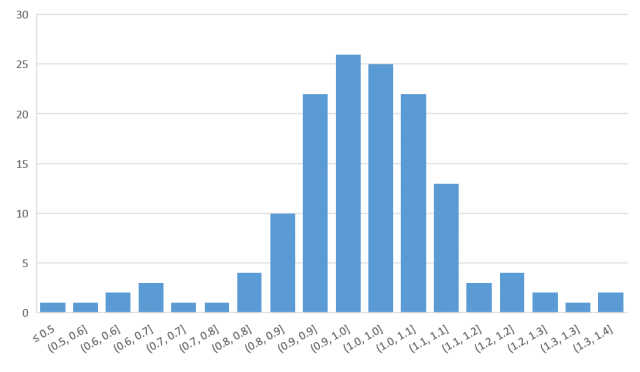
Figure 1 shows the significant variation in Merino marking rates between flocks. A similar spread in marking rates was observed in 2017 (WA Producer survey 2018).
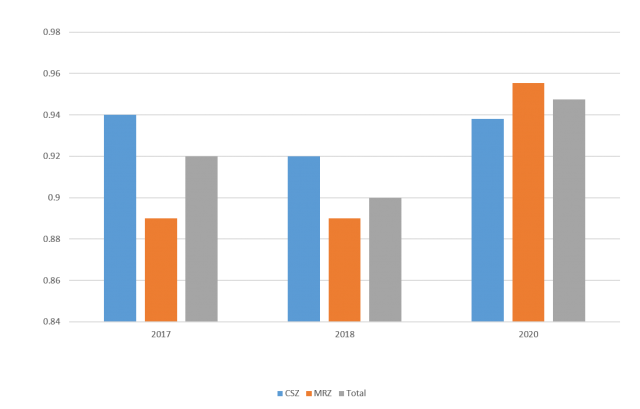
The average marking rates were slightly higher in the 2020 season compare to 2018 (WA Lambing Survey) and 2017 (WA Producer survey 2018) season (Figure 2).
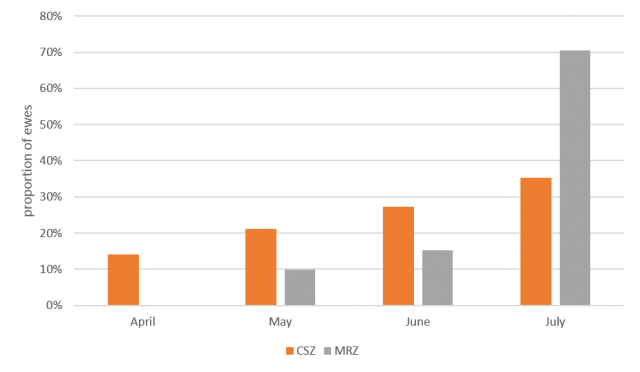
Merino producers in the CSZ tended to lamb earlier than the MRZ (Figure 3). The peak marking rate was in July (35%) with the remainder in the months February to June. Merino producers in the MRZ lambed later with a peak in marking rates in July (70%). This is different to results in the larger 2011 Producer survey (Jones & Curnow 2012) and 2018 Producer survey data (Conte & Curnow 2018) where the peak lambing for Merinos in the CSZ was May.
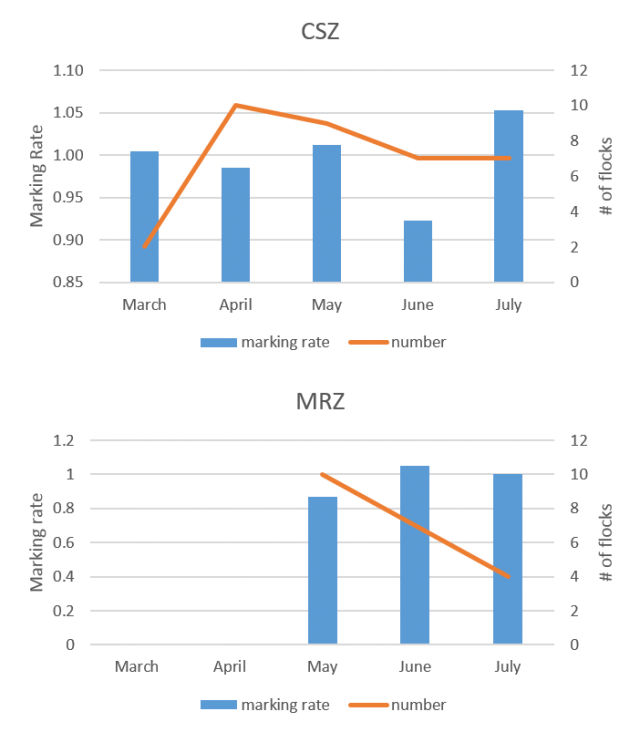
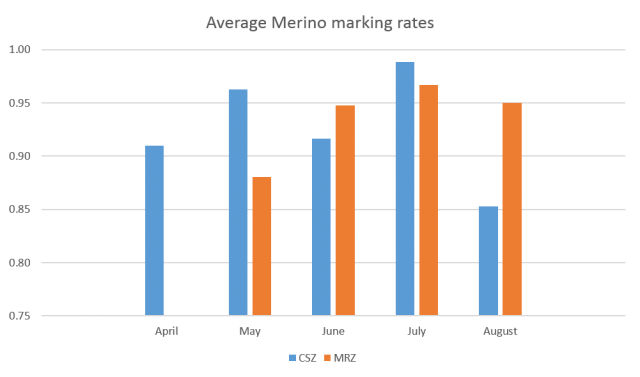
There was no clear pattern to the marking rate by month in Merino matings for the CSZ (Figure 4), however, marking rates in the MRZ peaked in July which is consistent with other surveys.
Crossbred flocks
Producers who consider themselves a dual enterprise ie. producing wool and meat, make up more than 60% of the sheep producers in WA. Many of these run dual purpose flocks which are Merino ewes crossed to a meat sire to produce and turnoff first cross lambs.
The marking rate for Merino to meat sire mating (crossbred) flocks in the CSZ was higher but not significant than that of the MRZ and the reproductive rate (pregnancy scanning %) reflected that (Table 3). The number of ewes represented in the sample is 79 000.
| # of crossbred flocks | Pregnancy scanning %* | Av Marking rate** | |
|---|---|---|---|
| Cereal sheep zone | 35 | 137 | 0.99 |
| Medium rainfall zone | 21 | 107 | 0.96 |
| Total | 56 | 110 | 0.98 |
*foetuses/ewe mated ** lambs marked per ewe mated
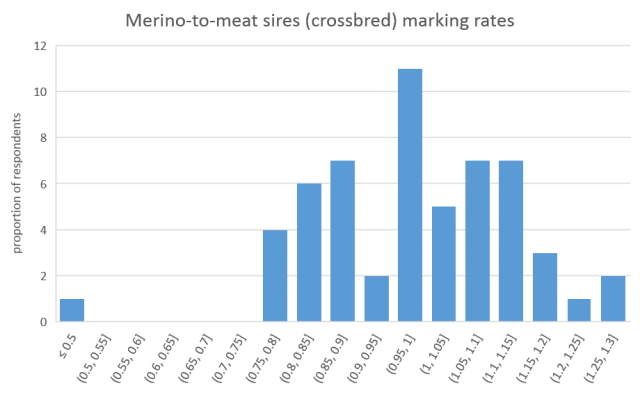
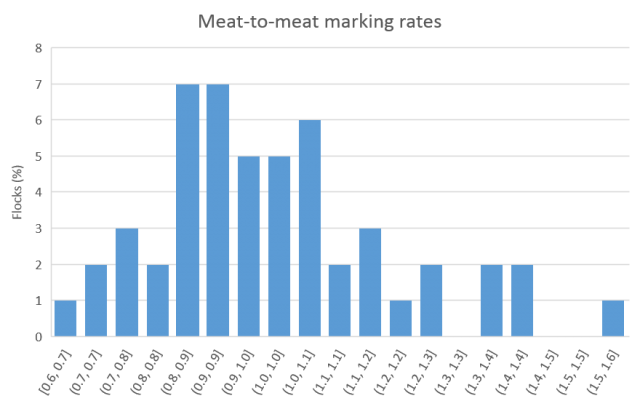
The histogram of marking rates (Figure 5) shows a similar range of marking rates to the Merino matings, albeit with one very low result which lowered the median marking rate substantially (Table 4).
| Merino x meat | |||
|---|---|---|---|
| Zone | Average marking rate | Median marking rate | |
| Cereal sheep zone | 0.99 | 1.00 | |
| Medium rainfall zone | 0.96 | 0.89 | |
| Total | 0.98 | 0.94 | |
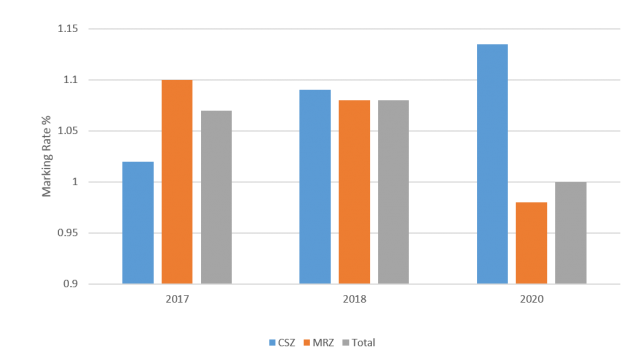
Marking rates for crossbred lambs in the MRZ for the 2020 season were significantly higher than in 2018 (Figure 6) but had a reduced sample size (40,000 compared to 113,000 ewes). The levels were similar to that achieved in 2017. Marking rates in the CSZ were remarkably consistent across the three years of surveys. This may be a related to the lower reliance on green feed at lambing and a greater reliance on supplementary feed in the autumn.
There was very little range in the marking rate by lambing month across both zones. In the MRZ, lambing was concentrated in the months of May to July whereas lambing in the CSZ was more evenly spread across March to July (Figure 7). In 2018, July recorded the lowest marking rates for crossbred flocks in the CSZ which wasn’t replicated in this sample.
Meat flocks
Meat flocks including maternals are a smaller portion of the state ewe flock but was well represented in the survey with 30% of the sample by flock.
The marking rate averaged 100% but wasn’t consistent across zones. There were very few (n=7) flocks and only 8% of the ewes represented in the CSZ in the meat to meat matings in this survey which may compromise the accuracy of these results. The results for the 44 flocks in the MRZ returned a disappointing result of 98% marking (Table 5). Of these, only six flocks were scanned for pregnancy status (with an average marking rate of 116%).
| # of Meat flocks | Pregnancy scanning %* (n=8) | Marking rate** | |
|---|---|---|---|
| Cereal sheep zone | 7 | 137.5 | 1.13 |
| Medium rainfall zone | 44 | 139.7 | 0.98 |
| Total | 51 | 139.2 | 1.00 |
*foetuses/ewe mated ** lambs marked per ewe mated
The highest proportion of flocks in meat to meat matings achieved less than 100% and it was only a small number of high performing flocks that lifted the marking rate in the MRZ (Figure 8). Using data analysed by DPIRD (Tamara Alexander, pers comm) only four meat flocks met the breakeven threshold for the marking rate required by a meat flock to offset the loss of a wool clip.
The average marking rates were higher in the CSZ in the 2020 season compared to 2018 (WA Lambing Survey) and 2017 (WA Producer survey 2018) season (Figure 9), however, the results from the 44 flocks in the MRZ performed significantly poorly compared to the 2018 and 2017 years survey.
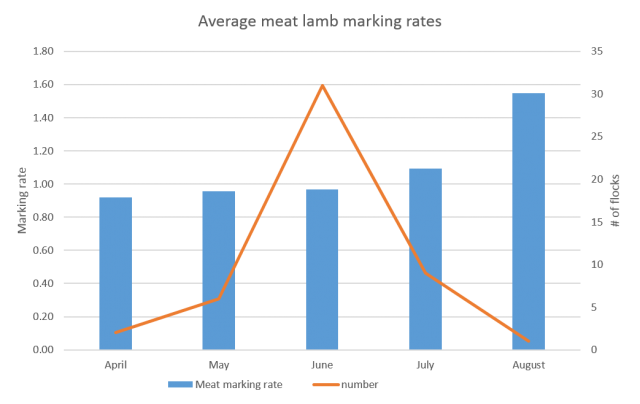
The peak month for lambing in meat flocks was June with very few flocks lambing outside of this time (Figure 10).
Ewe lambs
2020 was the first year we have asked questions about mating ewe lambs. There were 11 respondents, of which three flocks were Merino ewe lamb matings and eight were meat ewe lamb matings with a total of nearly 9000 ewe lambs.
| # participants | # ewe lambs mated | Pregnancy scanning % | Average marking rate | |
|---|---|---|---|---|
| Cereal sheep zone | 4 | 3110 | 80 | 0.44 |
| Medium rainfall zone | 7 | 5854 | 100 | 0.74 |
| Total | 11 | 8964 | 96 | 0.65 |
Overall impacts
Lambing marking data is not regularly collected on a large scale in WA. We therefore must rely on a sample of data that may mask some of the lower results; particularly in a poor season where producers maybe uncomfortable with sharing data that they see is not reflective of their usual results. Also many producers do not see the value in the collection of data or have the time or records which makes participating simple in a survey such as this. Other sources of data for lambing rates are the MLA & AWI Wool and Sheepmeat Survey conducted by the Lamb Forecasting Committee three times a year. This data will be used to build a better picture of the state’s sheep resource.
| Grower Group | Merino marking rate | Crossbred marking rate | Meat marking rate | Ewe lamb marking rate |
|---|---|---|---|---|
| ASHEEP | 0.92 | 0.93 | 1.41 | 0.56 |
| Compass Ag | 0.96 | 0.92 | ||
| Corrigin Farm Improvement Group | 0.98 | |||
| Facey Group | 1.05 | 1.21 | ||
| FEAR group | 0.90 | |||
| Gillamii Centre | 0.94 | 0.95 | 1.18 | 0.86 |
| Holt Rock Group | 0.79 | 1.06 | ||
| Liebe | 1.00 | |||
| LIFT | 0.83 | 0.95 | ||
| MADFIG | 0.90 | 0.96 | 1.05 | |
| Manjimup Pasture Group | 1.05 | 1.36 | ||
| MIG | 1.00 | 1.00 | ||
| MMPIG | 0.89 | 1.00 | 1.08 | |
| North Stirling Pallinup Natural Resources | 0.89 | 0.82 | ||
| Nyabing Farm Improvement Group | 0.94 | 0.90 | ||
| RAIN | 0.87 | 0.77 | ||
| SouthernDIRT | 1.04 | |||
| Stirling to Coast Farmers | 0.97 | 0.96 | 1.14 | 0.84 |
| Toodyay Ag Alliance | 0.80 | 0.83 | ||
| WA producer Co-op | 1.32 | 1.28 | ||
| West Midlands Group | 1.02 | 1.04 | 1.03 | 0.37 |
| N/A | 0.97 | 0.99 | 1.17 | 0.60 |
References
www.agric.wa.gov.au/sheep/western-australian-sheep-producer-surveys
Conte. J, Curnow. M, WA Producer Survey 2018, DPIRD
Jones. A, Curnow. M, WA Producer Survey 2011, DPIRD
www.agric.wa.gov.au/sheep/2018-wa-lambing-survey
Butcher. R, WA Lambing Survey 2018, DPIRD

