Recent climate
November rainfall was below average in some parts of the northern and central grainbelt, above in the eastern grainbelt and average elsewhere. Reports of heavy rainfall and hail in mid-November and early December, interfered with harvesting in some central and eastern areas. Fires in Dalwallinu from lighting strikes caused considerable damage. November maximum and minimum temperatures were below average to average.
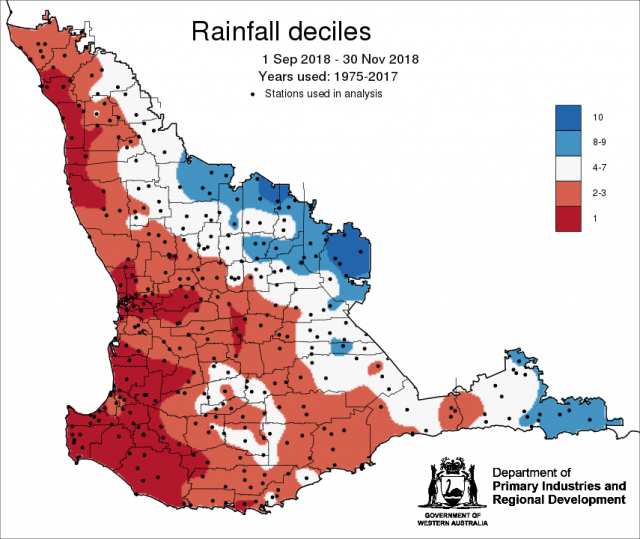
For spring, September to November 2018 was below average for parts of the northern and southern grainbelt. Areas of the eastern and Esperance shire received above average rainfall from thunderstorms across the region that delivered localised heavy falls. Fires in Dalwallinu from lighting strikes caused considerable damage. In the September Seasonal Climate Outlook, the SSF indicated below median rainfall and the Bureau indicated below median rainfall for the western parts of the SWLD.
In November, the atmospheric pressure was above normal over most of Australia except the far southeast, contributing to the below average rainfall for the majority of the grainbelt and south-west corner in WA. The Indian Ocean sea surface temperatures continue to be cooler than average to Australia's northwest. This can lead to reduced rainfall, as less atmospheric moisture is available for rain-bearing weather systems.
The Southern Annular Mode (SAM), also known as the Antarctic Oscillation (AAO), describes the north–south movement of the westerly wind belt that circles Antarctica, dominating the middle to higher latitudes of the southern hemisphere. SAM is currently positive. In a positive SAM event, the belt of strong westerly winds contracts towards Antarctica, resulting in weaker than normal westerly winds and higher pressures over southern Australia, restricting the penetration of cold fronts inland. The National Oceanic and Atmospheric Administration (NOAA) suggests that SAM is likely to remain positive until mid-December.
The positive IOD event, which began in early September, persists. However, model outlooks suggest it will decay by early summer, consistent with its natural decay cycle. A positive IOD during spring typically increases the chance of below-average rainfall for southern and central Australia. The IOD typically has little influence on Australian climate from December to April. See the Bureau of Meteorology’s IOD and Pacific Ocean interaction for details.
The development towards El Niño in the tropical Pacific Ocean continues, with outlooks suggesting El Niño is likely to form during the summer months. The Bureau's ENSO Outlook remains at El Niño ALERT, meaning there is at least a 70% chance of El Niño fully forming in 2018. In summer, El Niño typically brings drier conditions to parts of northern Australia and also typically brings warmer than average days to large parts of the continent.
The table below gives a summary of past month and three-month South West Land Division (SWLD) climate conditions, and can indicate what is likely to occur in the near future if climate conditions follow the current pattern.
| Climate Indicator | Past month | Past 3 months |
| SWWA Rainfall | Mixed | Below average |
| SWWA Mean Temperature | Below to average | Above Average |
| SWWA atmospheric pressure | Above Normal | Near Normal |
| Indian Ocean Sea surface temperature | Cooler | Cooler |
| El Niño/Southern Oscillation (ENSO) | Neutral | Neutral |
| Indian Ocean Dipole (IOD) | Positive | Positive |
| Southern Annular Mode (SAM) | Positive | Positive |

