Summary
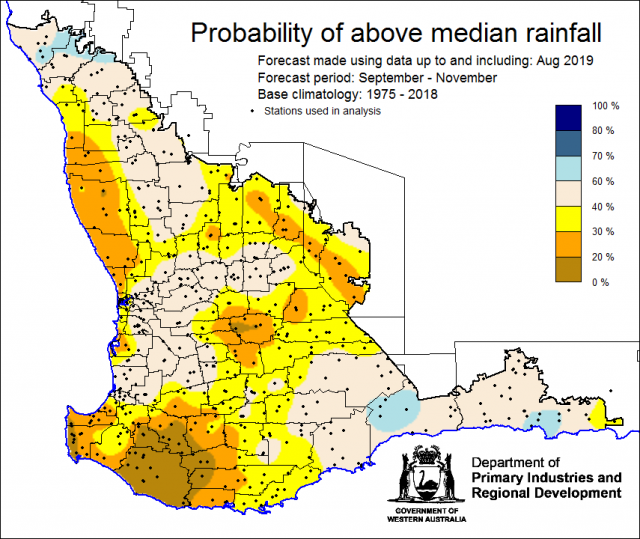
The Department of Primary Industries and Regional Development’s (DPIRD) Statistical Seasonal Forecast (SSF) outlook for spring, September to November 2019 is indicating less than a 40% chance of exceeding median rainfall for the majority of the South West land Division (SWLD).
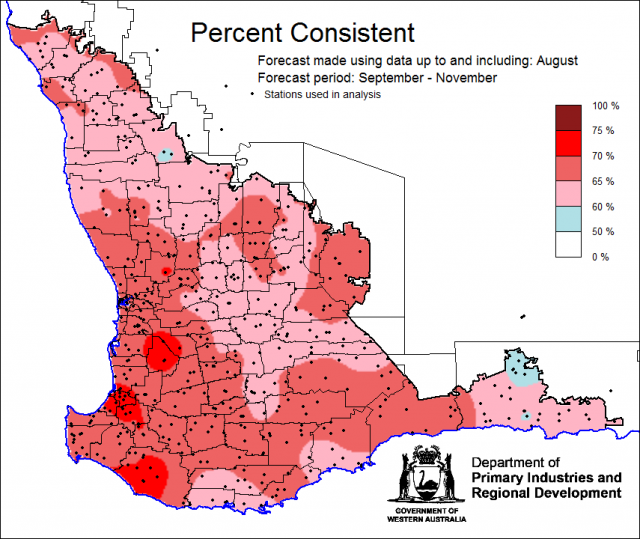
- For spring, September to November 2019, the SSF is indicating less than a 40% chance of exceeding median rainfall for parts of the Central West, Central Wheatbelt, Lower West and Great Southern Districts. Neutral (40-60%) chances, elsewhere. The most probable decile range is decile 2-3 for parts of the Central West, Central Wheatbelt, Lower West and Great Southern Districts and decile 4-7 for elsewhere. Predictive skill based on August conditions is poor to good (50 -75% consistent).
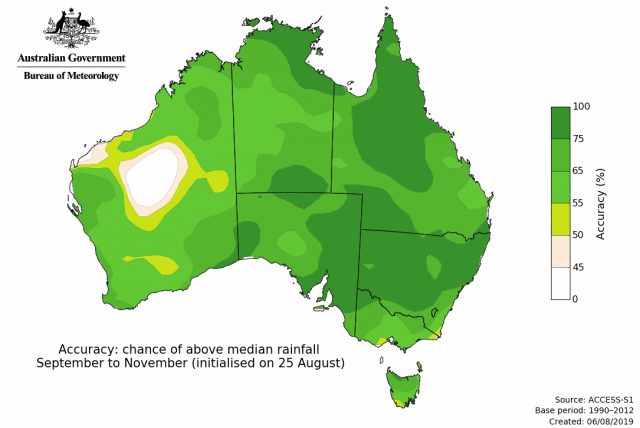
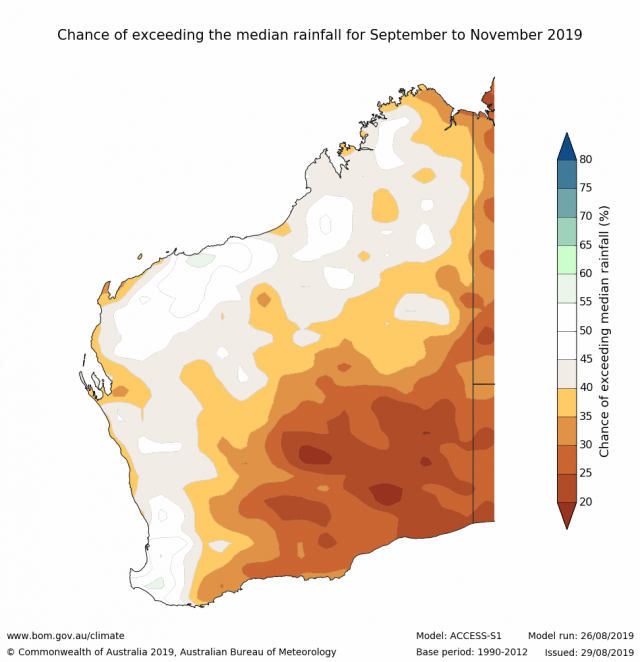
- The Bureau of Meteorology’s current seasonal outlook is indicating 25-50% chance of exceeding median rainfall for spring, September to November 2019, for the South West Land Division. Eastern parts have much lower chances of exceeding median rain. For the individual month of September, chances have increased to 50 to 70%. Predictive skill is moderate to good (55-75% consistent).
- Temperature outlooks for spring, September to November 2019, from the Bureau indicate a 55-80% chance of above average day-time maxima for the SWLD. Skill is poor to good at 55-100% consistent. Minimum temperature outlooks indicate a 55-75% chance of above average night-time minima for the SWLD, with skill poor to good 50-75% consistent.
- August rainfall, when compared with historical 1975-2018 rainfall, was average to above average.August maximum temperatures were very much above average and minimum temperatures were average.
- A positive Indian Ocean Dipole (IOD) remains the main driver of Australia’s climate over the coming months. A positive IOD is typically associated with below average rainfall and warmer than average days for large parts of southern and central Australia. With cloud-free days and nights expected, there is an increase of frost in susceptible areas.
Three Month Outlook for the south-west of Western Australia
Statistical Seasonal Forecasting (SSF)
DPIRD’s Statistical Seasonal Forecast (SSF) system uses historical relationships between global sea surface temperature and sea level pressure with rainfall in south-west Australia to produce forecasts of rainfall for the coming months. Users can click on any station indicated on the map for location-specific forecast information from the Seasonal Climate Information web page.
For spring, September to November 2019, the SSF is indicating less than a 40% chance of exceeding median rainfall for parts of the Central West, Central Wheatbelt, Lower West and Great Southern Districts. Neutral (40-60%) chances, elsewhere. The most probable decile range is decile 2-3 parts of the Central West, Central Wheatbelt, Lower West and Great Southern Districts and decile 4-7 for elsewhere. Predictive skill based on August conditions is poor to good (50 -75% consistent).
Bureau of Meteorology seasonal climate outlook
The Bureau of Meteorology's climate forecast system for monthly and seasonal climate outlooks is the Australian Community Climate Earth-System Simulator – Seasonal (ACCESS–S). It is a dynamical (physics-based) forecast modelling system and is a collaboration between the Bureau of Meteorology and the UK Meteorological Office.
The Bureau of Meteorology’s current seasonal outlook is indicating 25-50% chance of exceeding median rainfall for September to November 2019, for the overall South West Land Division. Eastern and south-eastern parts have much lower chances of exceeding median seaosnal rainfall. For the individual month of September, chances have increased to 50 to 70%. Predictive skill is moderate to good (55-75% consistent).
Temperature outlooks for September to November 2019, from the Bureau indicate a 55-80% chance of above average day-time maxima for the SWLD. Skill is poor to good at 55-100% consistent. Minimum temperature outlooks indicate a 55-75% chance of above average night-time minima for the SWLD, with skill poor to good 50-75% consistent. With more cloud-free days and nights expected, there is an increase of frost in susceptible areas.
Recent climate
August rainfall was average to above average. Winter (June to August ) rainfall when compared with historical 1975-2018 rainfall, was average to above average. August maximum temperatures were very much above average and minimum temperatures were average.
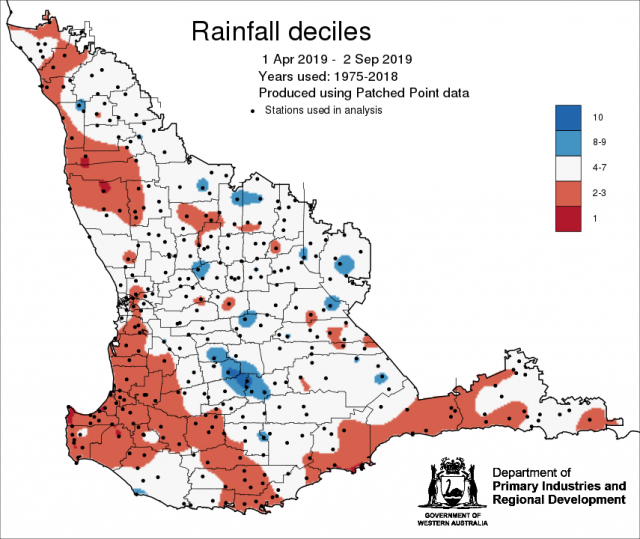
Rainfall since 1 April has been generally average (decile 4-7) for the SWLD, with drier areas in parts of the Central West, Lower West, South West, Great Southern and South East Coastal Districts (Bureau of Meteorology forecast districts).
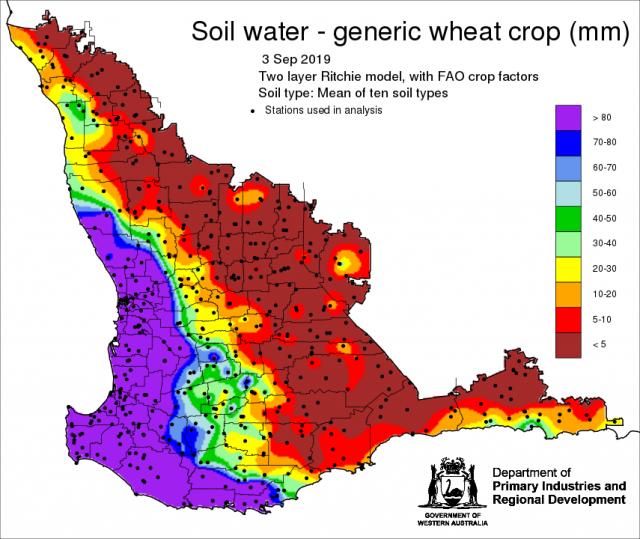
New soil water maps, for 10 soil types and their mean, are now available on the DPIRD website. These maps are different to the pervious soil water maps created in the early part of the season as they are created using evapotranspiration of a generic wheat crop which is estimated using the FAO crop factor method. This is the same method used to calculate the crop soil water in the soil water tool. The latest map to 3 September, indicates low soil water reserves in the Central West, Central Wheatbelt, Great Southern and South East Coastal Districts.
In August, the atmospheric pressure was above normal over the SWLD.
Indian Ocean sea surface temperatures off the WA coastline have been cooler than average. The September to November SST forecast by the Bureau of Meteorology indicates SSTs are likely to be near normal north of WA.
The Southern Annular Mode (SAM), also known as the Antarctic Oscillation (AAO), describes the north–south movement of the westerly wind belt that circles Antarctica, dominating the middle to higher latitudes of the southern hemisphere. For August, SAM was negative, where the belt of westerly winds expands and is positioned more northwards towards the equator and Australia. This results in stronger than normal westerly winds, lower atmospheric pressure, more cold fronts and more storm systems over southern Australia. Typically, this means that there are more rain events in winter for southern Australia. SAM is forecast to be neutral in the next couple of weeks.
The Indian Ocean Dipole (IOD) index has been above the positive IOD threshold for four of the past five weeks, with values strengthening in the past month. However, the broader Indian Ocean patterns of sea surface temperature, cloud, and wind have been consistent with positive IOD conditions since late May. All climate models surveyed by the Bureau forecast positive IOD conditions to continue until November. Typically, a positive IOD brings below average winter–spring rainfall to southern and central Australia, above average daytime temperatures for the southern two-thirds of Australia, and increased fire risk in the southeast. The El Niño–Southern Oscillation (ENSO), is expected to remain neutral for the remainder of 2019. For further information, see the Bureau of Meteorology’s ENSO Wrap Up.
The table below gives a summary of past month and three-month South West Land Division (SWLD) climate conditions, and can indicate what is likely to occur in the near future if climate conditions follow the current pattern.
| Climate Indicator | Past month | Past 3 months |
|---|---|---|
| SWLD Rainfall | Average to above average | Average to above average |
| SWLD Mean Temperature | Above Average | Above Average |
| SWLD atmospheric pressure | Above Normal | Above Normal |
| Indian Ocean Sea surface temperature | Cooler | Cooler |
| El Niño/Southern Oscillation (ENSO) | Neutral | Neutral |
| Indian Ocean Dipole (IOD) | Positive | Neutral |
| Southern Annular Mode (SAM) | Negative | Negative |

