2021/22 weather snapshots
With the 2021-22 wine grape harvest now complete, DPIRD Technical Officer Yu-Yi Liao has collated climatic data for each of WA’s nine wine regions. This provides an illustrated insight into the characteristics of the season (October to April) at a macro level for the regions.
The data displayed in the following graphs was accessed via DPIRD’s weather station and radar webpage and the Bureau of Meteorology (BoM).
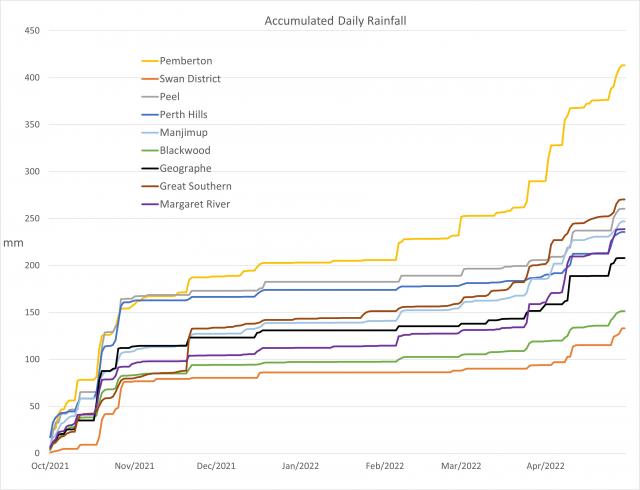
Figure 1 shows data collected from the BoM Millendon weather station (site number 9281) to represent the Swan District region. The region recorded 133mm over the growing season, with little rain during the ripening period (December - February).
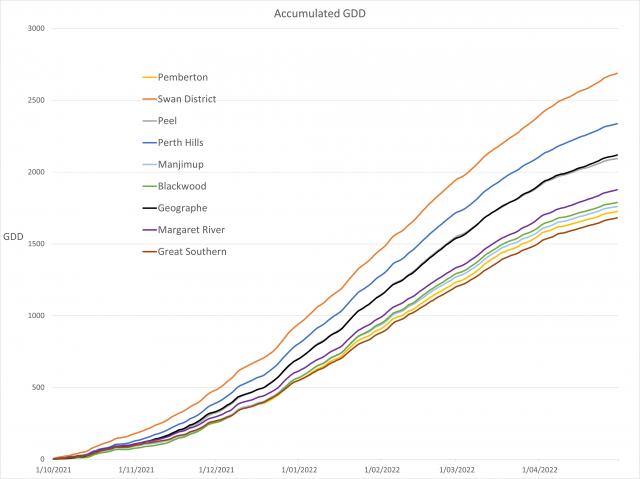
Three stations were used to represent the Perth Hills, being BoM station Bickley (site number 9240) and DPIRD stations Lesmurdie Testbed and Glen Eagle in Figure 2. Perth Hills accumulated 2338 GDD units compared to the 2688 recorded in the neighbouring Swan District and received 236mm of rain during the season.
Peel’s data in Figure 3 is sourced from BoM Dwellingup weather station (site number 9538).
DPIRD’s stations Capel, Donnybrook and Dardanup 2 were compiled to represent Geographe in Figure 4. Over the season 208mm of rainfall was recorded, the majority of which fell in the months of October, November and April.
Figure 5 illustrated Margaret River’s season with data from the DBCA-A Portable station and DPIRD’s units Vasse, Wilyabrup, Margaret River, Rosa Brook and Karridale. In April there were seven days where daily rainfall was recorded above 5mm, the total over the season was 239mm and total GDD for the period was 1877.
Blackwood Valley is shown in Figure 6 with data sourced from BoM Bridgetown station (number 9617), DBCA station Styles Tower and DPIRD station Nannup. Blackwood Valley recorded the second lowest rainfall during the season at 152mm and similar GDD as Manjimup and Pemberton at 1789.
The BoM station at Manjmup (site number 9573) and DPIRD’s Manjimup HRS station provided data to represent the growing season at Manjimup in Figure 7. Manjimup recorded 1761 GDD units and 247mm of rainfall during the season.
DPIRD Pemberton station was the only station used to produce Figure 8, seasons rainfall was the highest of all the regions at 413mm and 1726 accumulated GDD's.
Acknowledging the size and diversity of the Great Southern wine region, all subregions were combined to produce Figure 9. Stations used were Albany Airport (9741) and Rocky Gully Town (9661) of which are both BoM stations, Water Corporation station Quickup Dam and DPIRD stations Denmark, Mt Barker, Stirlings South, Frankland North and Frankland. Accumulated totals for GDD were 1682 and 270mm rainfall.
Figure 10 shows the comparative accumulated Growing Degree Days (GDD) for all regions calculated using the Winkler Index with a base of 10°C.
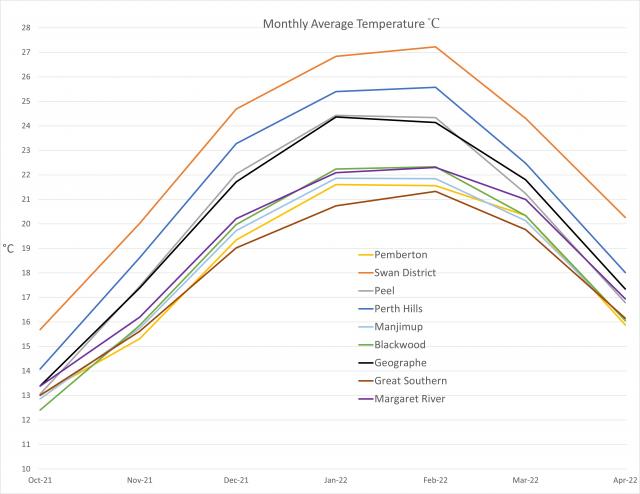
Monthly average temperature is shown in Figure 11. The Swan District as expected, shows a clear separation from the other regions being the hottest of WA’s wine regions. Another obvious grouping is Margaret River, Blackwood Valley, Manjimup, Pemberton and Great Southern at the lower range of monthly mean temperatures across the growing season.
Pemberton is clearly separated in Figure 12 from the other regions in terms of accumulated rainfall over the growing season. This is attributed to a number of daily rain events between February and April exceeding 15mm.


