Alan and Helen Hawley, King River: long-term monitoring and liming program
Property information
Average rainfall: 762 millimetres (mm)
Enterprise: Short horn beef cattle
Dominant soils: Deep sandy and gravelly duplexes and clay loams
Background
Alan Hawley has tried a number of different innovations to improve his profitability and soil management however the two that have given the biggest benefits have been planting kikuyu and liming.
Alan was aware that he had a pH problem on the farm. This was evident through soil testing and the pasture composition. As a result he was on the lookout for something that would help deal with the issue.
In the early 1980s Alan went to a department field day in the South Stirlings area. It was demonstrating the yield increase in crops from applying lime. From this Alan decided to give it a go and applied lime to one of his most acidic paddocks.
The response was fantastic with an increase in clover content and size which motivated him to continue. There was also the potential that he would be able to decrease phosphate applications due to the increase in pH.
Monitoring
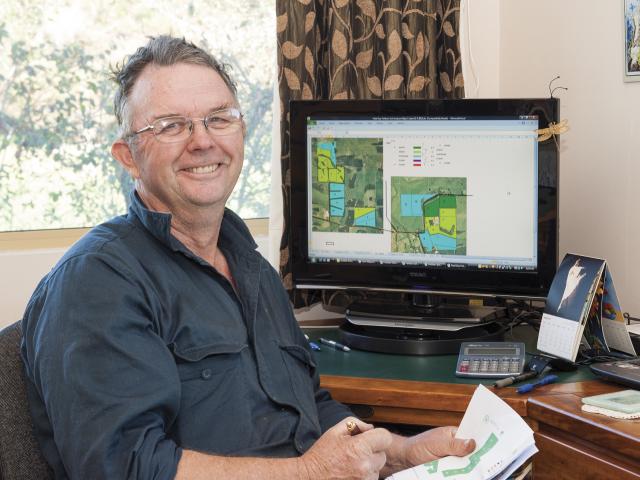
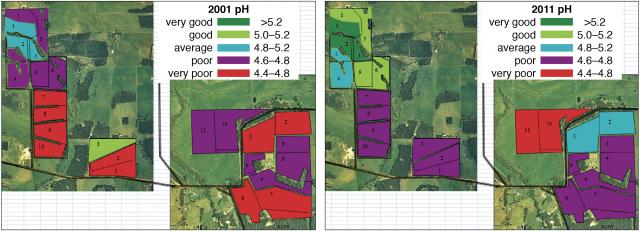
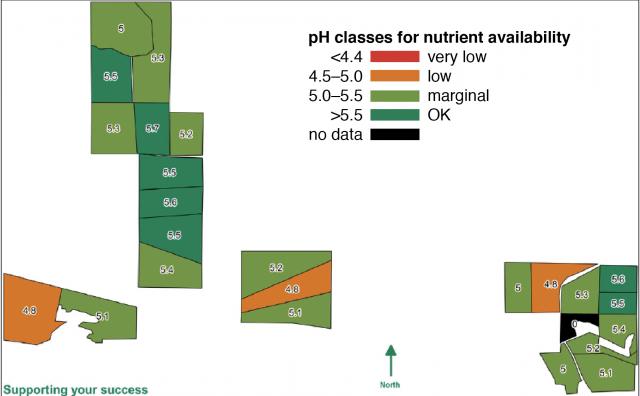
Alan uses Microsoft Excel to record a range of data including his soil test results, fertiliser applications, lime applications and stocking rates. He also uses critical levels to determine nutrient and pH status and has mapped these since 2001. As a result it is possible to see the changes in soil nutrients and pH over many years (Figure 1).
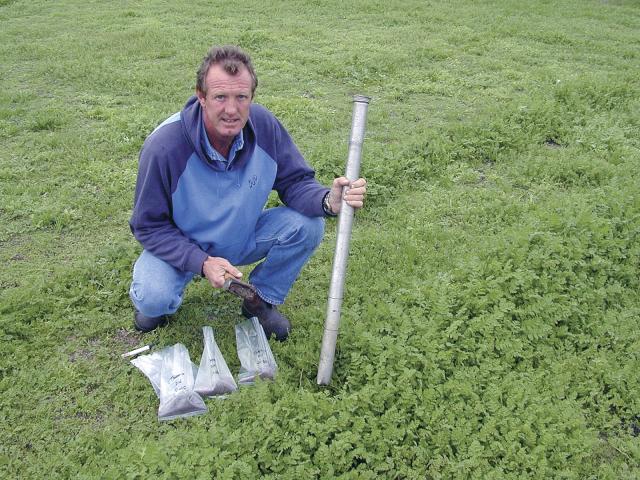
Alan maps his farms by soil/land management unit. He then takes 30-50 cores from each unit, which he then combines and mixes before taking a subsample for analysis. This makes it easier to sample and analyse by combining similar soil types that are managed in the same way.
In 2013, Alan’s farm was mapped under the whole farm nutrient mapping project run by the department (Figure 2). This project funded the sampling and analysis of Alan’s entire farm, paddock by paddock for macro nutrients, pH and Phosphate buffering Index. This provided an excellent opportunity to compare the current 2013 mapping results with data from Alan’s innovative mapping and data storage, which goes back to the mid 1980s.
Implementation
Allan’s approach was to apply lime fairly regularly. He aimed to treat the entire farm at least every five years. Rates did vary but they were around 2.5 tonnes per hectare (t/ha). This meant that every paddock got one and sometimes two applications in five years, which is roughly the strategy he has been using since the late 1980s.
Over the last five years Alan ramped up his application of lime. He applied an average of 4.3t/ha of lime over the five years across the farm. This did however vary with between 2.5 and 5t/ha applied across the different paddocks. Rates were based on economics, the pH at the time and future activities such as hay cropping.
In the late 1980s the pHCa of the farm was low with paddocks ranging between 3.8 and 4.4. Alan then started to lime the farm regularly and by 2001 the average pHCa across the farm was 4.6 though this did vary between 4.1 and 5.1 (Figure 1). By 2011 the average pHCa across the farm was 4.8 with at least 50% of the property between 4.4 and 4.8 (Figure 1). This was encouraging, however the pH was still too low.
By 2013 the average pHCa was 5.3 with paddocks ranging between 4.8 and 5.7. On average the pH increased by 0.5 units over three years with the increase in pH varying from 0.2 to 0.9 pH units across the property.
If we look at one area in particular, Hazard Rd paddocks 9 and 10, the pHCa in 1985 was 4.3. Over the next few years the pHCa gradually increased with fairly regular applications of lime to 4.6 by 2011. The cumulative effects of continued liming started to pay dividends and by 2013 the pHCa had reached 5.5 (Table 1, Figure 2).
| Year | pHCa |
|---|---|
| 1985 | 4.3* |
| 2011 | 4.6 |
| 2013 | 5.5 |
Total lime application in Hazard Rd paddocks 9 and 10 between 1985 and 2011 was 12.35t/ha which was applied usually in lots of 2.5t/ha using two main lime sources. A further 2.47t/ha was applied in 2012 which brought the total up to 14.8t/ha since 1985.
The other factor that Alan has considered is the quality of the lime. From 1985-2008 he used lime that had a neutralising value of around 83%. From 2008-2011 he used another source that had a lower neutralising value of approximately 60%.
Despite the rates being applied, Alan felt that the lime was not ameliorating the acidic soils adequately, which was supported by the apparent drop in average pH from 2008-2011. In 2008 the average pHCa across the farm was 5, however by 2011 it had dropped to 4.8. Alan then swapped back to his normal source of lime and the pH in 2013 was up on average to 5.3, with paddocks ranging from 4.8 to 5.7 (Table 2).
| Year | Average pH | Highest pH | Lowest pH | % of paddocks above pH 5 |
|---|---|---|---|---|
| 2001 | 4.6 | 5.1 | 4.1 | 8 |
| 2008 | 5.0 | 5.3 | 4.8 | 50 |
| 2011 | 4.8 | 5.3 | 4.5 | 23 |
| 2013 | 5.3 | 5.7 | 4.8 | 91 |
Summary
Alan has seen a dramatic change in the quality of his pasture. While there are many factors that can influence this, Alan is sure that part of the change can be attributed to the improvements in soil pH. He now has more clover and rye grass in his sward, which is better able to persist amongst the kikuyu pasture. This has been especially evident on the flats where he had bare areas and large amounts of lotus minor, which has now been almost completely replaced by rye grass and clover.
The other benefit is the greater availability of nutrients with higher pH. He is able to produce the same amount of feed with less fertiliser and now that the whole farm has been sampled he is more certain of being able to cut back on fertiliser applications by halving current rates, except for paddocks producing hay.
Now that the pH has reached the target levels Alan is planning to drop lime applications back to maintenance levels. He will still follow the same methodology of liming the entire farm every five years but will drop application rates back to between 1-1.5t/ha and will continue to monitor the soil nutrient and pH levels and adjust rates accordingly.
The increases in pH have occurred due to a long-term program of liming. Some amount of variability has occurred, however since the 1980s there has been a general upwards trend. This has shown that even in paddocks with pHCa as low as 3.9 it is possible to bring them up to an acceptable level and reap the rewards.
Regular monitoring has been the key to success. He has been able to identify the issue, apply the solution and where necessary adjust his approach. This would not have been possible without regular rigorous soil testing, information storage and management.
David and Alex Leake, Kellerberrin: long-term benefits of liming
Property information
Average annual rainfall: 310mm
Enterprise mix: cereal-lupin rotation, usually 2-3 years wheat
Predominant soil types: tenasol (yellow sandy earth)
Background
David and Alex Leake established a trial in 1991 to investigate the benefits of liming sand plain soils. Following the Kellerberrin Demonstration Group field walk in 2008, the Department of Primary Industries and Regional Development and Precision SoilTech became involved as part of the Wheatbelt Natural Resource Management soil acidity project with funding from Caring for our Country.
Trial treatments and management
In 1991, limesand (with neutralising value 90%) was surface-applied to plots (15m x 100m) at 1, 2.5 and 5t/ha and replicated three times with an unlimed plot in each replicate as a control. The trial area was subject to the same management regime as the rest of the paddock.
In 2001, 1t/ha of limesand was surface-applied to all plots as part of whole-paddock liming. For ease of identification, the treatments are referred to by the initial lime application rates.
Soil pH and aluminium
The starting pHCa of the trial area, based on soil test results taken around the same time, was 4.8 in the surface and 4.5 in the 10-20cm layer. The soil pH deeper in the soil profile was not measured at the time but is assumed to have been around 5, which is typical for the soil type and cropping history.
In 2009, on the 2.5, 1 and 0t/ha plots, where insufficient lime had been applied, the soil pH profiles were increasingly acidic and aluminium levels increasingly toxic (Figure 1). To recover these soil pH profiles to meet DPIRD targets an estimated 7-10t/ha would be required and may take 10-20 years.
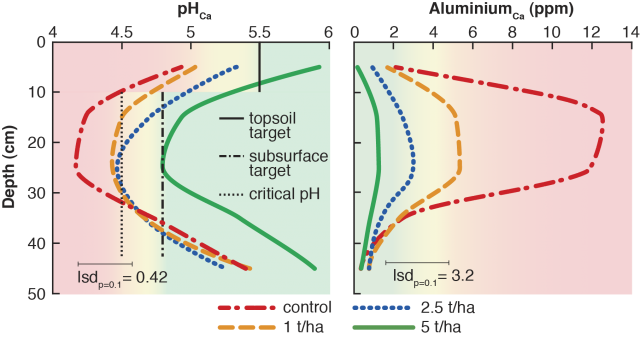
On the 5t/ha plot, where sufficient lime had been applied (6t/ha in total), the soil pH profile met the DPIRD recommended values 18 years after the initial application. At these levels, aluminium in the subsurface is nontoxic to root growth (Figure 2).
Similar results most likely would have been achieved by applying the 6t/ha of lime in two applications of 3t/h over the first 10 years. An additional 2t/ha of lime over the next 10 years will probably maintain the soil profile at the department's targets.
Wheat and barley grain yields
The 5t/ha limed plots yielded 0.58t/ha more wheat than the unlimed plots in 2008 and 0.55t/ha more in 2012 (Table 1). At wheat prices of $300/t this represented $174 and $165 extra per hectare respectively.
In 2009 the 5t/ha limed plots yielded 1.52t/ha more barley than the unlimed plots, representing $225 extra per hectare at barley prices of $174/tonne (t).
Managing soil pH in this trial returned $560 additional income per hectare over the three crops measured alone.
| Lime (t/ha) | 2008 wheat | 2008 wheat | 2009 barley | 2009 barley | 2012 wheat | 2012 wheat |
|---|---|---|---|---|---|---|
| N/A | t/ha | % of max | t/ha | % of max | t/ha | % of max |
| 0 | 2.92 | 83 | 0.7 | 32 | 1.64 | 75 |
| 1 | 3.30 | 94 | 1.10 | 50 | 1.74 | 80 |
| 2.5 | 3.20 | 91 | 1.76 | 82 | 1.79 | 82 |
| 5 | 3.50 | 100 | 2.22 | 100 | 2.19 | 100 |
Barley and weed biomass
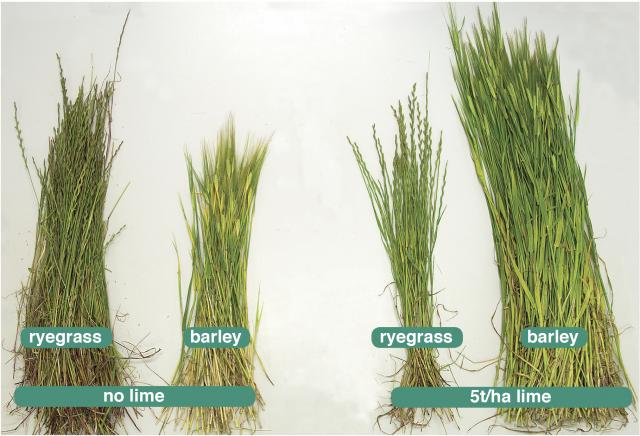
Barley grain yield increases were not completely explained by the soil pH and aluminium profiles. There was a strong interaction between lime treatments and weed burden with the reduced weed burden on the 5t/ha plots contributing to the increased grain yield.
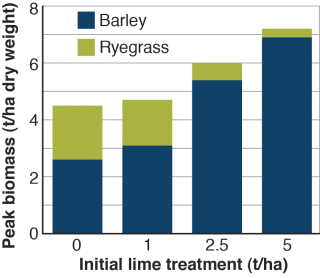
Limed plots produced 60% more barley biomass than unlimed plots and, in addition, unlimed plots contained proportionally more ryegrass than plots limed at 5t/ha 18 years ago (Figures 2 and 3). Increased crop competitiveness and potentially better herbicide efficiency on soils with good pH combine to fight weeds and reduce the weed seed bank over time.
Conclusions
Six tonnes per hectare (5t/ha initially, plus 1t/ha after nine years) of surface-applied lime was sufficient to recover topsoil pH and maintain it at or above pHCa 5.5 at 18 years after the initial application. This enabled the subsurface soil to be maintained at or above pHCa 4.8 to a depth of 50cm thus preventing aluminium toxicity.
Increased lime use has many benefits to the farming system in addition to increasing yields. Removing acidity as a constraint increased grain yield and crop competitiveness, reduced the weed burden and decreased the risk of soil erosion by increasing biomass cover.
David Leake believes that without liming his profitability and long term future would be in question. Having seen the benefits of liming, David is committed to an ongoing liming program involving the reliming of paddocks every 3-10 years depending on the amount of acidification. He sees a good return on investment by maximising the value of his other fertiliser and chemical inputs and by the improvement in yield continuing 15-20 years after liming.
Mal and Justin King, Bindi Bindi: surface and deep-placement liming
Property information
Average annual rainfall: 360mm
Enterprise mix: crop and pasture
Predominant soil types: deep sands and sandy duplex
Trial treatments
This trial was established in 1996 as a long-term DPIRD demonstration site on a sandy gravel soil. Plots 50m x 200m were treated with surface applications of 1 and 2t/ha of limesand. Control plots were unlimed and all treatments had three replications.
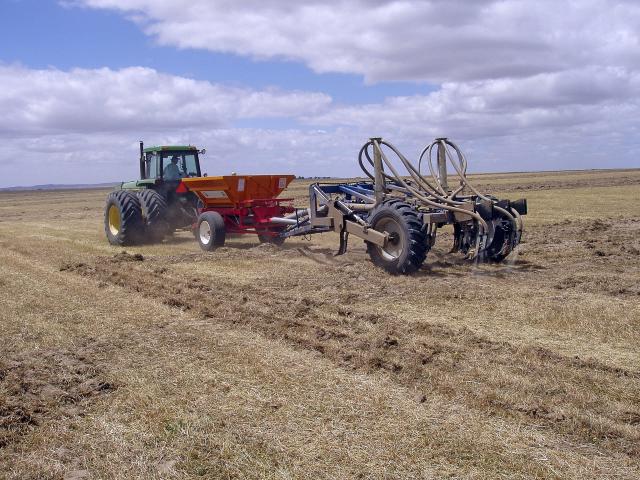
In 2005 the existing plots were further divided with new liming and deep ripping treatments to test the value of placing lime in the subsurface using modified deep-ripping equipment. A shallow leading tine ripper coupled to a multi-spreader with a venturi distribution system was used to place lime in the subsurface.
The leading tine placed lime at 15-20cm and the following tine placed lime at 20-25cm. Tine spacing was 450mm (Figure 1).
The new treatments were:
- no extra lime added to the original treatments, not deep-ripped
- no extra lime added to the original treatments, deep-ripped to 25cm
- surface application of 1.5t/ha lime, not deep-ripped
- 1.5t/ha lime deep-placed during deep ripping to 25cm
The trial was managed by Mal and Justin King as part of normal paddock operations.
Impact of surface-liming
Soil pH
Initially, the soil pH profile was below targets of pHCa 5.5 in the surface and 4.8 in the subsurface and required liming to recover the 0-10, 10-20 and 20-30cm layers to the appropriate pH and prevent aluminium toxicity in the subsurface.
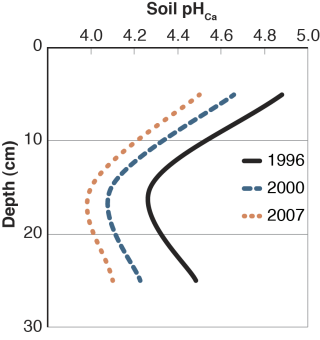
The impact of agriculture on soil pH is clearly demonstrated by comparing the pH in the unlimed plots over time (Figure 2). Where no lime was applied the soil profile continued to acidify and by 2000 was well below appropriate pH. By 2007, eleven years of farming without liming had resulted in a severely acidic profile.
Application of 1t/ha of lime in 1996 improved surface pH for a few years but was insufficient to prevent the subsurface from acidifying and by 2004 the whole profile was below target pH. When the pH was measured in 2007 the additional 1.5t/ha of lime that was surface-applied in 2005 had only improved the surface pHCa to 5.1 which was still below target and insufficient to recover the subsurface pH which remained severely acidic (Figure 3).
Where insufficient lime was applied, the soil pH profile was not sufficiently improved to give a return on investment considering the cost of liming.
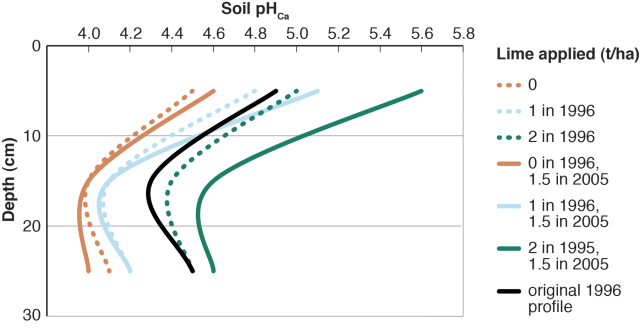
In 2007, having been above the topsoil target pH for many years, the soil pH for the plots limed at 2t/ha in 1996 was back to the pH levels before liming, indicating that the applied lime had been completely used. Re-liming the 2t/ha plots with 1.5t/ha in 2005 resulted in the soil pH being above target in the topsoil and above critical (pHCa 4.5) in the subsurface by 2007 (Figure 3).
Additional lime would have been needed in the following few years to counter ongoing acidification and bring the subsurface soil to target pH. Applying lime early was an advantage. Although insufficient, applying 1t/ha lime in 1996 had more impact on soil pH in 2007 than applying 1.5t/ha in 2005.
Soil aluminium
Soil pH was a good predictor of aluminium levels (Table 1). As a rule of thumb, aluminium concentration less than two parts per million (ppm) is nontoxic, 2-5ppm is toxic to sensitive species and greater than 5ppm is toxic to tolerant species. In 2007, even in plots where the largest amount of lime had been applied, the subsurface soil was below the target of pHCa 4.8 and the aluminium concentration was 2ppm or above.
This would restrict the choice of crop and pasture species to tolerant varieties to avoid inhibited root growth. In the plots where no lime or only 1.5t/ha had been applied in 2005, the lower pH resulted in aluminium concentrations that were toxic and would have inhibited root growth, even in tolerant species and varieties.
| Surface-applied lime (t/ha) | Soil depth (10-20cm) | Soil depth (10-20cm) | Soil depth (20-30cm) | Soil depth (20-30cm) |
|---|---|---|---|---|
| N/A | pHCa | Al (ppm) | pHCa | Al (ppm) |
| 0 | 4.0 | 7 | 4.1 | 7 |
| 0 in 1996 + 1.5 in 2005 | 4.0 | 9 | 4 | 8 |
| 1 in 1996 | 4.1 | 4 | 4.2 | 3 |
| 1 in 1996 + 1.5 in 2005 | 4.1 | 5 | 4.2 | 4 |
| 2 in 1996 | 4.4 | 2 | 4.5 | 2 |
| 2 in 1996 + 1.5 in 2005 | 4.6 | 3 | 4.6 | 2 |
Wheat yield
Wheat grain yield was measured in 1996, 1998, 2004, 2007 and 2009 (Table 2). Surface-applied lime does not usually change soil pH sufficiently in the year of liming to produce a yield response and this was the case in this trial. In subsequent years, the plots limed at 2t/ha in 1996 yielded 10-20% more than the unlimed plots.
A basic economic analysis showed the cumulative benefit of the 1996 2t/ha lime treatment from five years of wheat to be $425/ha. The benefit of the additional 1.5t/ha applied in 2005 from two wheat rotations was $250/ha (Table 2).
| Year | Wheat yield (t/ha) | Yield increase (%) | Benefit ($/ha)* | ||||
|---|---|---|---|---|---|---|---|
| N/A | No lime | 2t/ha lime | 2+1.5t/ha lime | 2t/ha lime | 2+1.5t/ha lime | 2t/ha lime | 2+1.5t/ha lime |
| 1996 | 2.2 | 2.2 | N/A | 0 | N/A | 0 | N/A |
| 1998 | 1.6 | 1.8 | N/A | 11 | N/A | 50 | N/A |
| 2004 | 2.5 | 3.2 | N/A | 22 | N/A | 175 | N/A |
| 2007 | 2.6 | 2.9 | 2.9 | 10 | 10 | 75 | 75 |
| 2009 | 2 | 2.5 | 2.7 | 20 | 26 | 125 | 175 |
The benefits of roots being able to grow uninhibited into the subsoil varies from season to season. In years where water is not limiting there will be less benefit. In the majority of seasons plants rely on stored subsoil water which deeper roots are able to access at the end of the season.
Pasture response to liming
Pasture biomass was measured in 2005. The biomass was 70% greater in the 2t/ha lime treatment plot than the unlimed plot. This improvement would have been as a result of improved nodulation of the legume-based pasture and improved availability of nutrients in the topsoil where the pH was appropriate.
Impact of deep-placing lime
Deep-placing lime into the soil using the modified deep-ripper leads to a highly variable soil pH profile because the lime is not thoroughly mixed with the soil. The lime ends up in uneven but reasonably continuous sausage-shaped seams of limed soil through the depth of incorporation.
When done correctly, deep-placed lime provides pathways of higher pH soil through the acidic soil to better (more alkaline) soil below. In this case soil sampling to test the pH usually does not reflect the complete impact of liming. The impact of effective deep-placement of lime in improving the acidic soil profile can be seen in productivity and yield improvements.
In this trial, deep-placement was only beneficial in the previously unlimed plots (Figure 4). These plots had the most severe subsurface acidity constraint.
In 2007, the plots that received 2t/ha of lime in 1996 yielded the most wheat grain, regardless of subsequent liming or ripping treatments. In the previously unlimed plots, deep-placing 1.5t/ha of lime in 2005 increased wheat yield to almost as much as the plots that received 2t/ha lime in 1996.
In 2009, the differences in yield between the 1996 treatments were greater and the plots with the best soil pH profile yielded the most grain; 2t/ha of lime in 1996 plus 1.5t/ha in 2005. Again in 2009, the deep-placed lime improved wheat yield in the previously unlimed plots but only to around the same as the plots limed at 1t/ha in 1996.
Conclusions
The trial site had continued to acidify under a crop and annual pasture rotation where no lime had been applied which resulted in a severely acidic soil profile. In 2007, this site would have required 5-7t/ha of high quality lime over the next 10 years to recover the profile to target pH. Additional costs as a result of ongoing productivity losses would be incurred during the recovery phase.
In contrast, there was a large benefit in the long term from applying sufficient lime in 1996 and then re-applying lime in 2005.
The earlier lime can be applied, the better. Lost productivity and future cost of pH amelioration need to be considered in the medium to long term when making decisions about investing in liming.
If you have very acidic subsurface soil it may be worthwhile incorporating lime to provide pathways of improved soil pH through which roots can grow. The deep-placement method used in this trial is very difficult to get right and of no value if you don't.
Other methods such as rotary spading are probably more suitable. For further information about strategies to incorporate lime to depth see Applying lime.
Tony White, Miling: lime incorporation by spading
Property information
Average growing season rainfall: 230mm
Enterprise: Cropping and livestock
Dominant soil: Yellow sand plain
Background
After extensive subsoil testing for pH, Tony White recognised a significant acidity constraint in the 10-30cm layer. Tony decided to trial incorporation by spading after surface application of limesand to one of his paddocks to speed up the amelioration of the subsurface layers.
Trial treatments and management
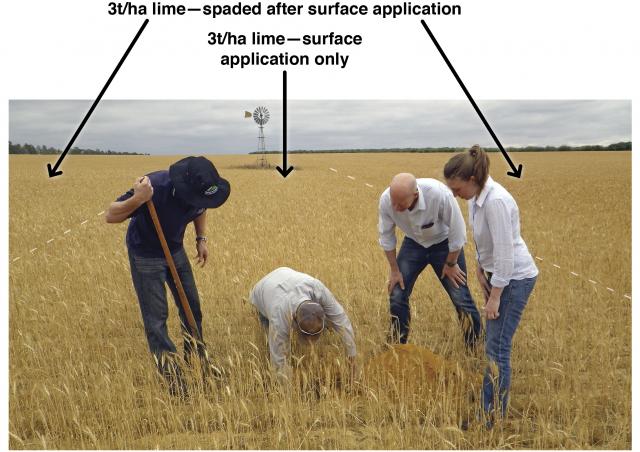
In 2012, limesand was spread on the surface of the paddock at 3t/ha. The paddock was then spaded to 35-40cm depth, leaving an area approximately 40m x 150m unspaded. The paddock was managed as usual and sown to wheat (Figure 1).
Effectiveness of lime incorporation
Visual inspection of small soil pits (stained with universal pH indicator) showed that limed topsoil was reasonably well incorporated by the spading treatment (Figure 2). The distribution of lime was uneven, but there was enough limed soil throughout the acidic 10-40cm layer to provide pathways for roots to grow into the nonacidic soil below. This is reflected in the large spread of pH values at each depth from the replicate samples (Figure 2).
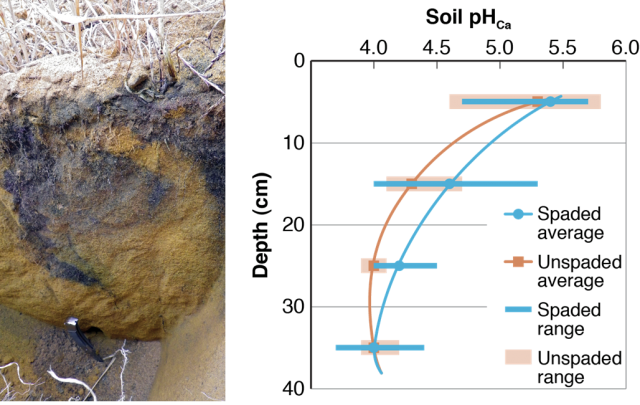
The soil pH profile of the undisturbed limed area was less variable and showed that there was a significant barrier to root growth from 10cm down to 40-50cm with average soil pHCa of 4-4.3. Beyond this, soil pHCa increased to around 5 where aluminium toxicity would not constrain root growth.
Root growth and water usage
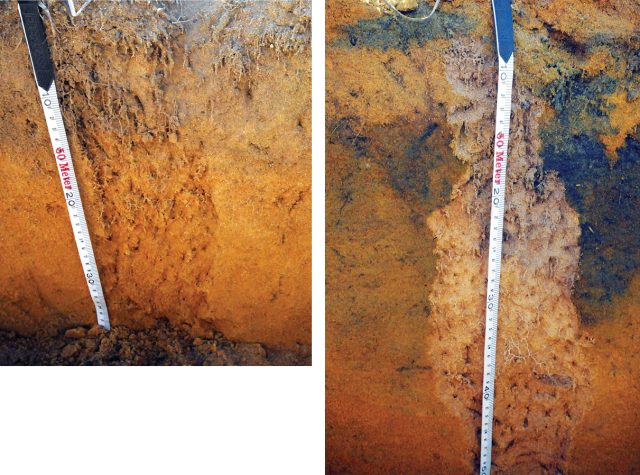
In early November 2012 when the crop was ready for harvest, roots in the unspaded profile were present at a depth to 20-25cm. In the spaded profile, many more roots were observed to a depth of 40-50cm (Figures 3). Detailed soil sampling showed that the spaded profile was dryer to a depth of 1m (Figure 4). The crop in the spaded area had been able to access and use subsoil moisture to considerable depth.
Wheat yield
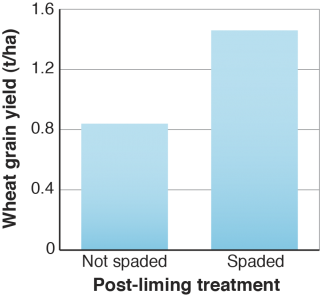
Deeper rooting depth, and therefore access to more subsurface moisture, resulted in significantly greater grain yield (Figure 5). The value of the extra 0.7t/ha of wheat is enough to have paid for the lime and spading and the benefits of the improved profile will be ongoing.
Conclusion
Tony White's work demonstrates how incorporation of lime by spading can improve crop growth on an acidified soil profile.
Lime applied to the surface at 3t/ha was sufficient to bring the 0-10cm soil pHCa to almost 5.5, which would have improved microbial activity and nutrient availability in this layer. In the first year after liming, where the soil was not spaded, the subsurface soil was still very acidic.
Over time, some alkalinity will move down the profile and improve the subsurface soil pH. However, this will take many years and require approximately 5t/ha more lime to be applied over the next 10 years to recover the subsurface pHCa to 4.8.
Incorporation of the limed surface soil by spading resulted in a highly variable pH in the subsurface soil but provided pathways of higher pH down to 40cm. Roots were able to grow down through these pathways to access subsoil moisture. Tony will need to apply lime to the surface in the future to counter the ongoing acidification that is an inevitable part of agriculture.
Tony did not set out to do a scientific study and there were no areas in the paddock that had no lime and no spading or no lime with spading for comparison. Spading is known to have effects such as removing compaction and distributing nutrients and organic matter.
Therefore, we can't attribute all the improved growth to an improved pH profile. However, there was no evidence of compaction and the root growth and soil moisture observations strongly indicate that pathways of improved soil pH were primarily responsible for the improved crop performance on the spaded areas of Tony's paddock.
Incorporation of surface-applied lime by spading is a good option to recover very acidic profiles on deep sands.
The old tennis courts at Tammin
Background
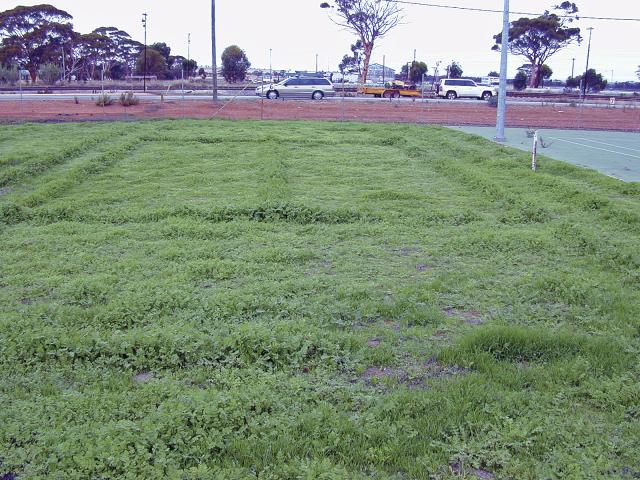
For years the grass tennis courts at Tammin were kept ready for use by regular fertilising, mowing and marking of the lines with chalk. After they were decommissioned and left unkept, the lines of the courts were still marked by growth differences in the grass and invading weeds (Figure 1).
Acidification and liming
The two major causes of soil acidification - product removal from mowing and nitrate leaching from fertiliser - would have acted to acidify the soil of the courts. This can be seen in the off-line pH values in Table 1. The soil profile is acidic down to at least 30cm. In the topsoil, the availability all major nutrients would be reduced.
The activity of beneficial microbes would be reduced and if any legumes had come in as weeds nodulation would be poor. In the subsurface, aluminium would be toxic and root growth restricted. It is not surprising that the growth of the grass and weeds is so poor in the areas of the court that don't make up the lines.
| Sample depth (cm) | Soil pHCa | Soil pHCa |
|---|---|---|
| N/A | On lines | Off lines |
| 0-10 | 4.3 | 3.9 |
| 10-20 | 4.9 | 3.6 |
| 20-30 | 5.5 | 3.8 |
Chalk used for marking lines on tennis courts is primarily calcium carbonate and acts in the same way as agricultural lime. Consequently, the pH of the soil on the lines is much higher than off the lines. The topsoil is a quarter as acidic on the lines compared to off the lines, but even so, is still well below pHCa 5.5 which is the recommended topsoil target for farming.
Although growth of the grass and weeds is substantially greater on the lines, it could be even better if the pH was higher. The subsurface pH on the lines is above the recommended target for agriculture (pHCa 4.8) and would not be causing aluminium toxicity. The roots of the plants would be able to explore a greater depth of soil to access moisture and nutrients.

